Dartmouth College SuperDARN Group 

Space Plasma Remote Sensing using Ground-based HF Radars
About SuperDARN
With the help of Dartmouth College students, students and colleagues from three other institutions, Thayer School professor Simon Shepherd constructed a pair of high-frequency backscatter radars in the desert of central Oregon over the Summer and Fall of 2010. These radars are funded by the National Science Foundation (NSF) and are part of an internationally funded global network of radars known as the Super Dual Auroral Radar Network (SuperDARN). There are more than 37 SuperDARN radars currently operating in the northern and southern hemispheres (maps).
During normal operation, pulses of radio waves are transmitted in a beam directed forward of the antenna arrays. The radio signal travels up into the Earth's ionosphere and is partially reflected by irregularities in the plasma that makes up the ionosphere. The reflected (backscattered) signal travels back to the radar where the Doppler shift in the signal is measured. Using the same principle as that used by weather radar to detect motions of the atmosphere, a SuperDARN radar can measure the speed at which plasma is moving. By combing observations from all of the radars in the network, a comprehensive view of the plasma motion in the polar ionospheres can be measured and used in studies of the electromagnetic coupling between the solar wind the Earth's magnetosphere. (more information about SuperDARN radars)
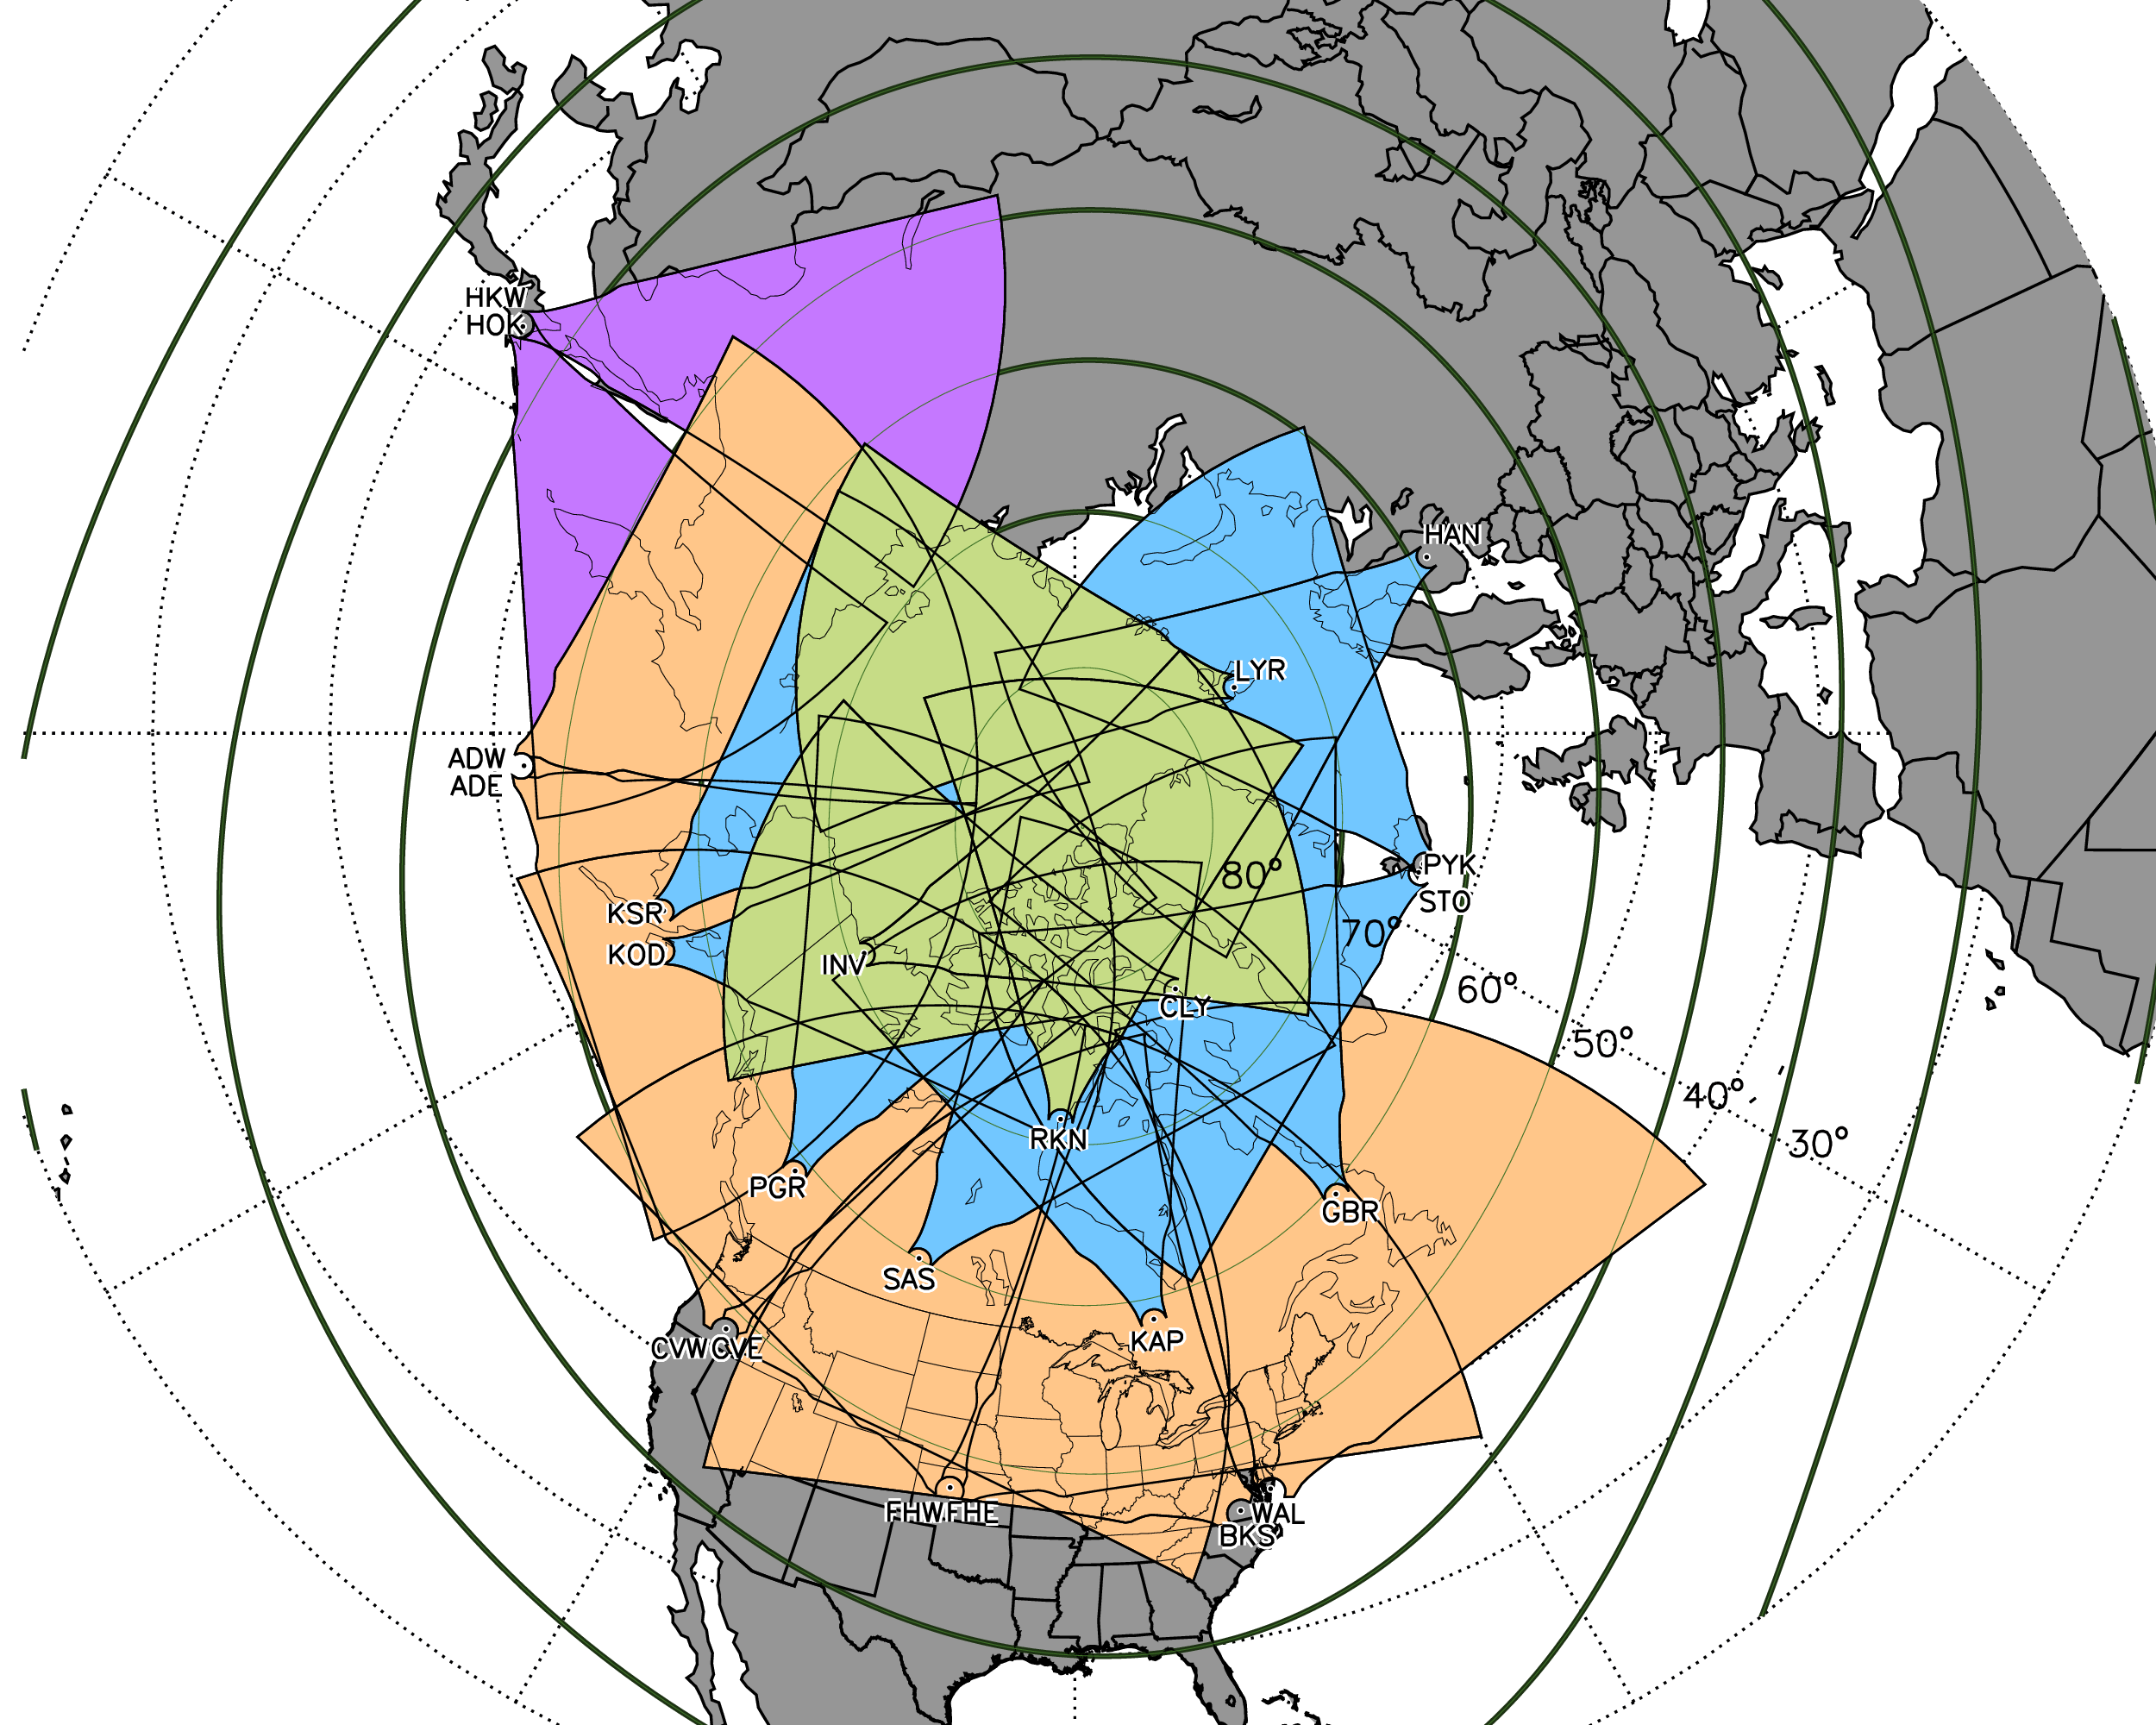
Real-time SuperDARN Convection Patterns
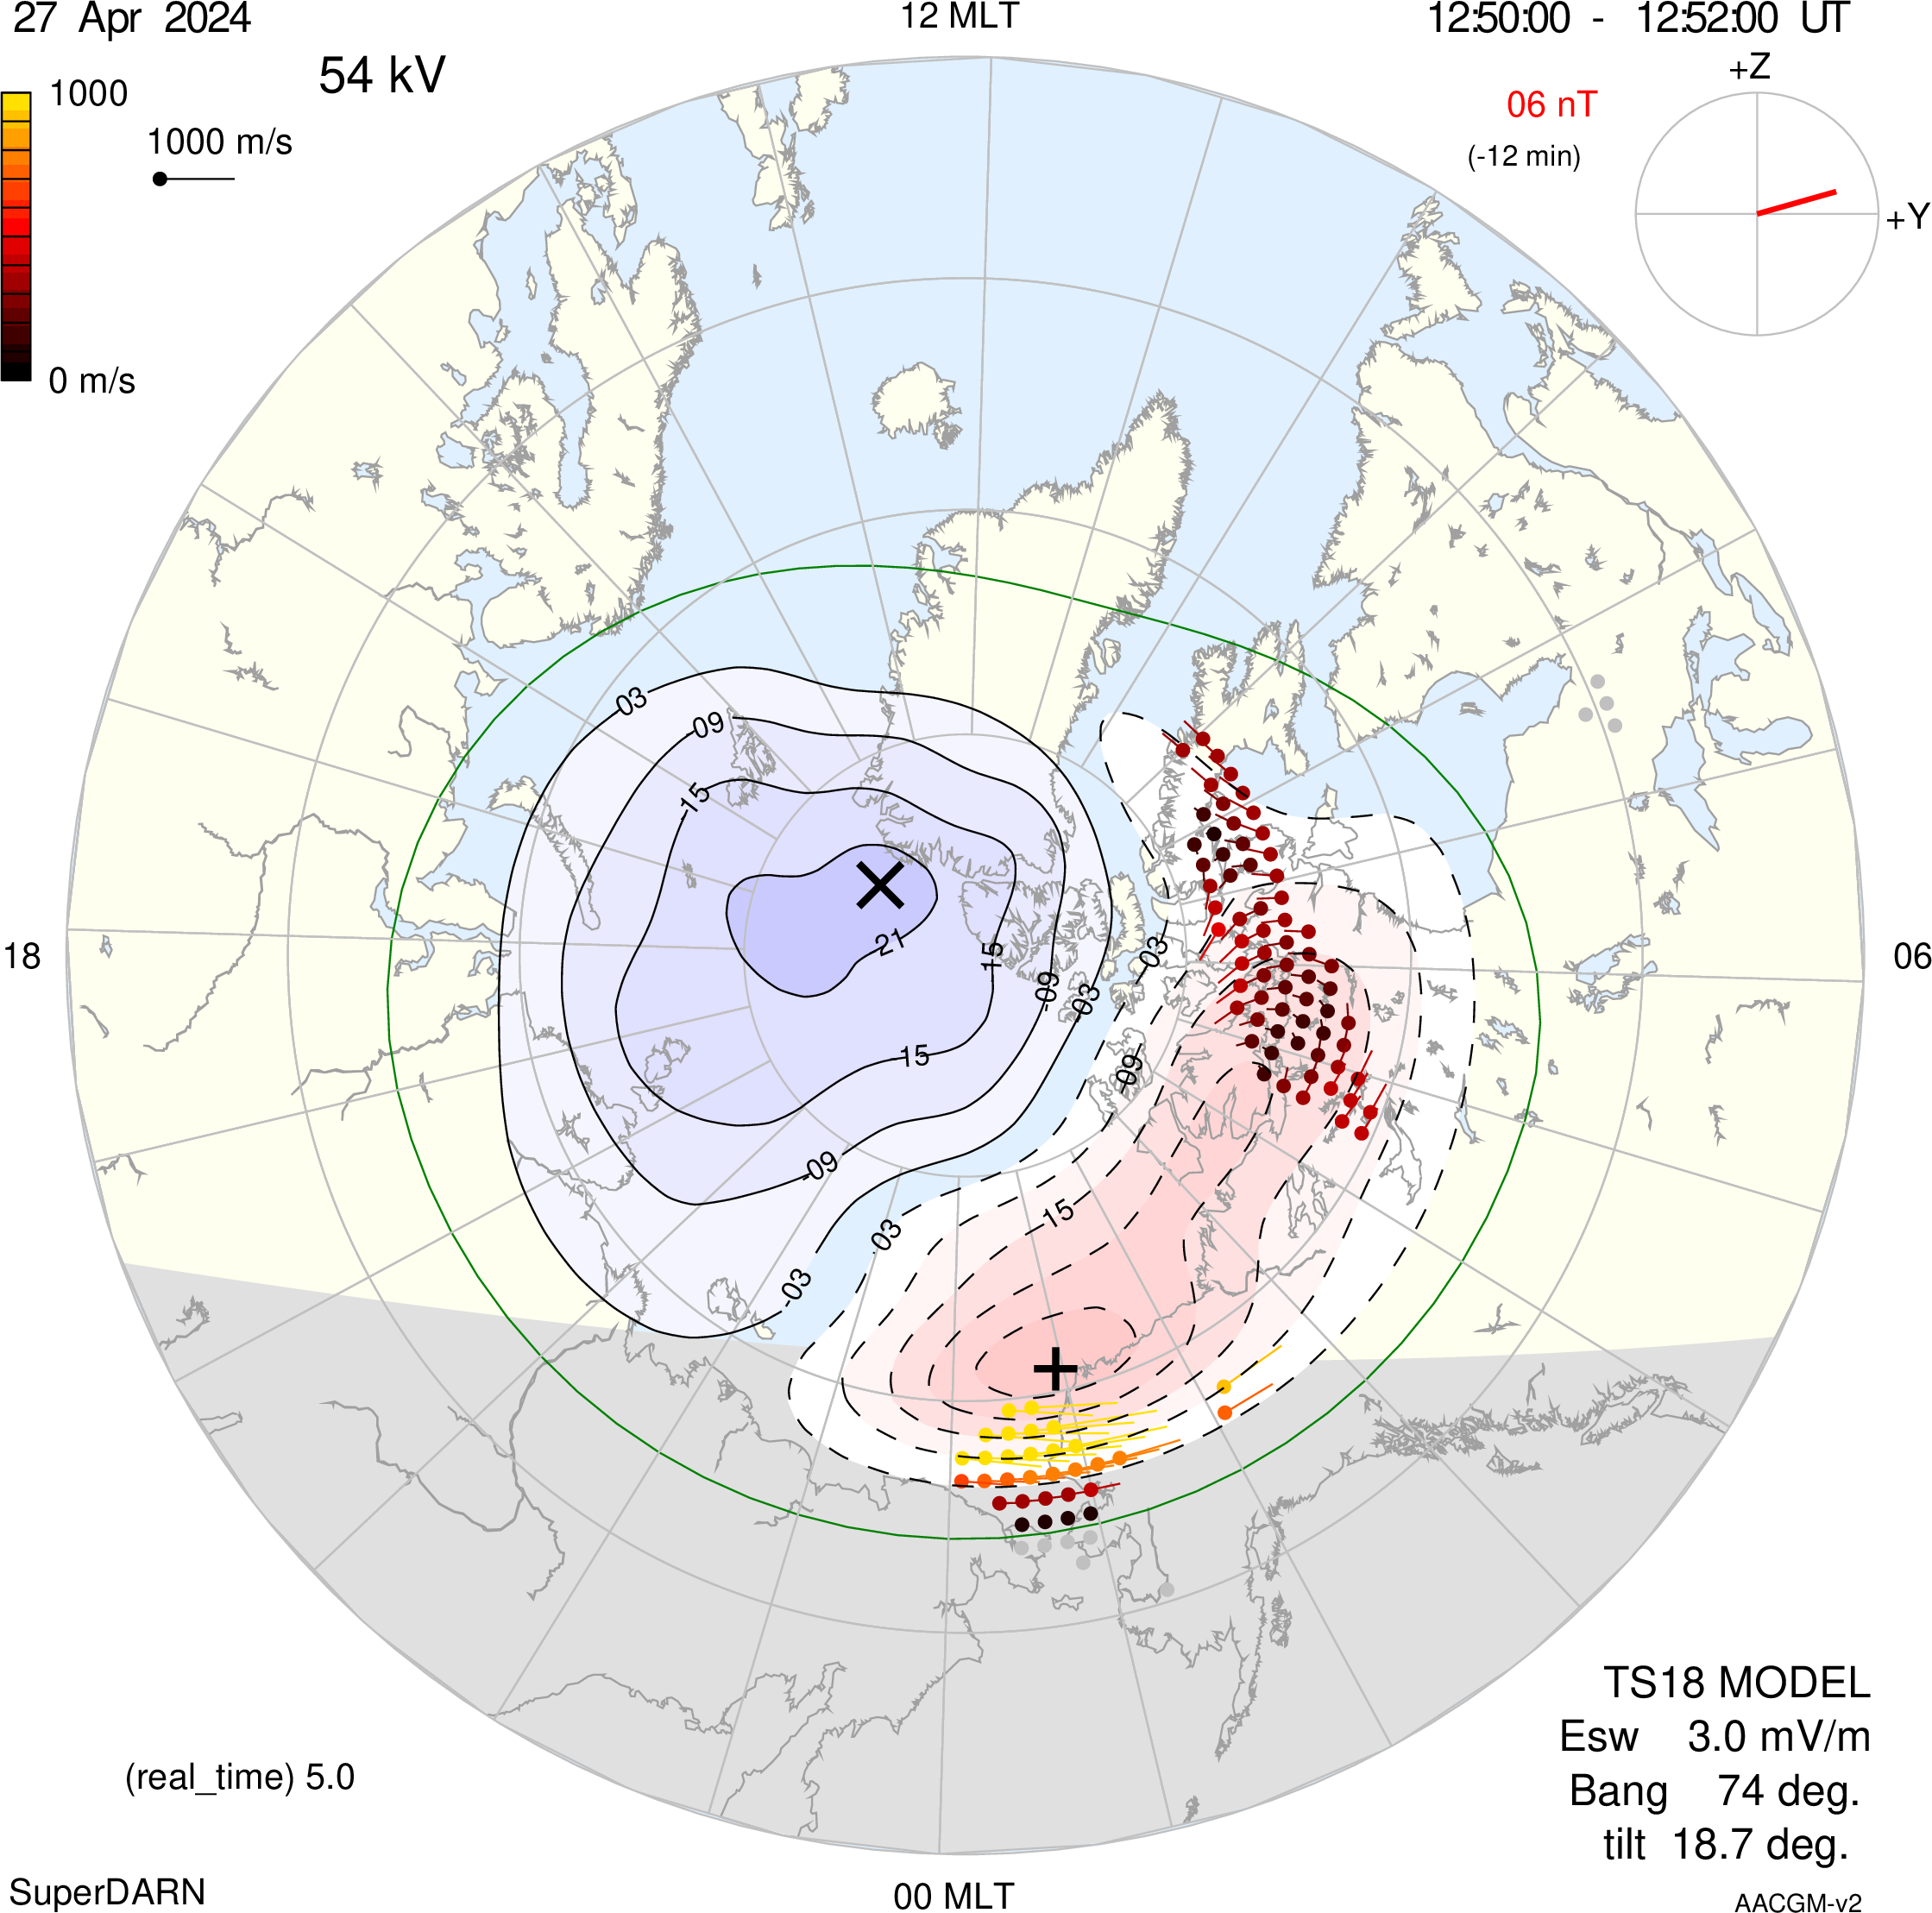
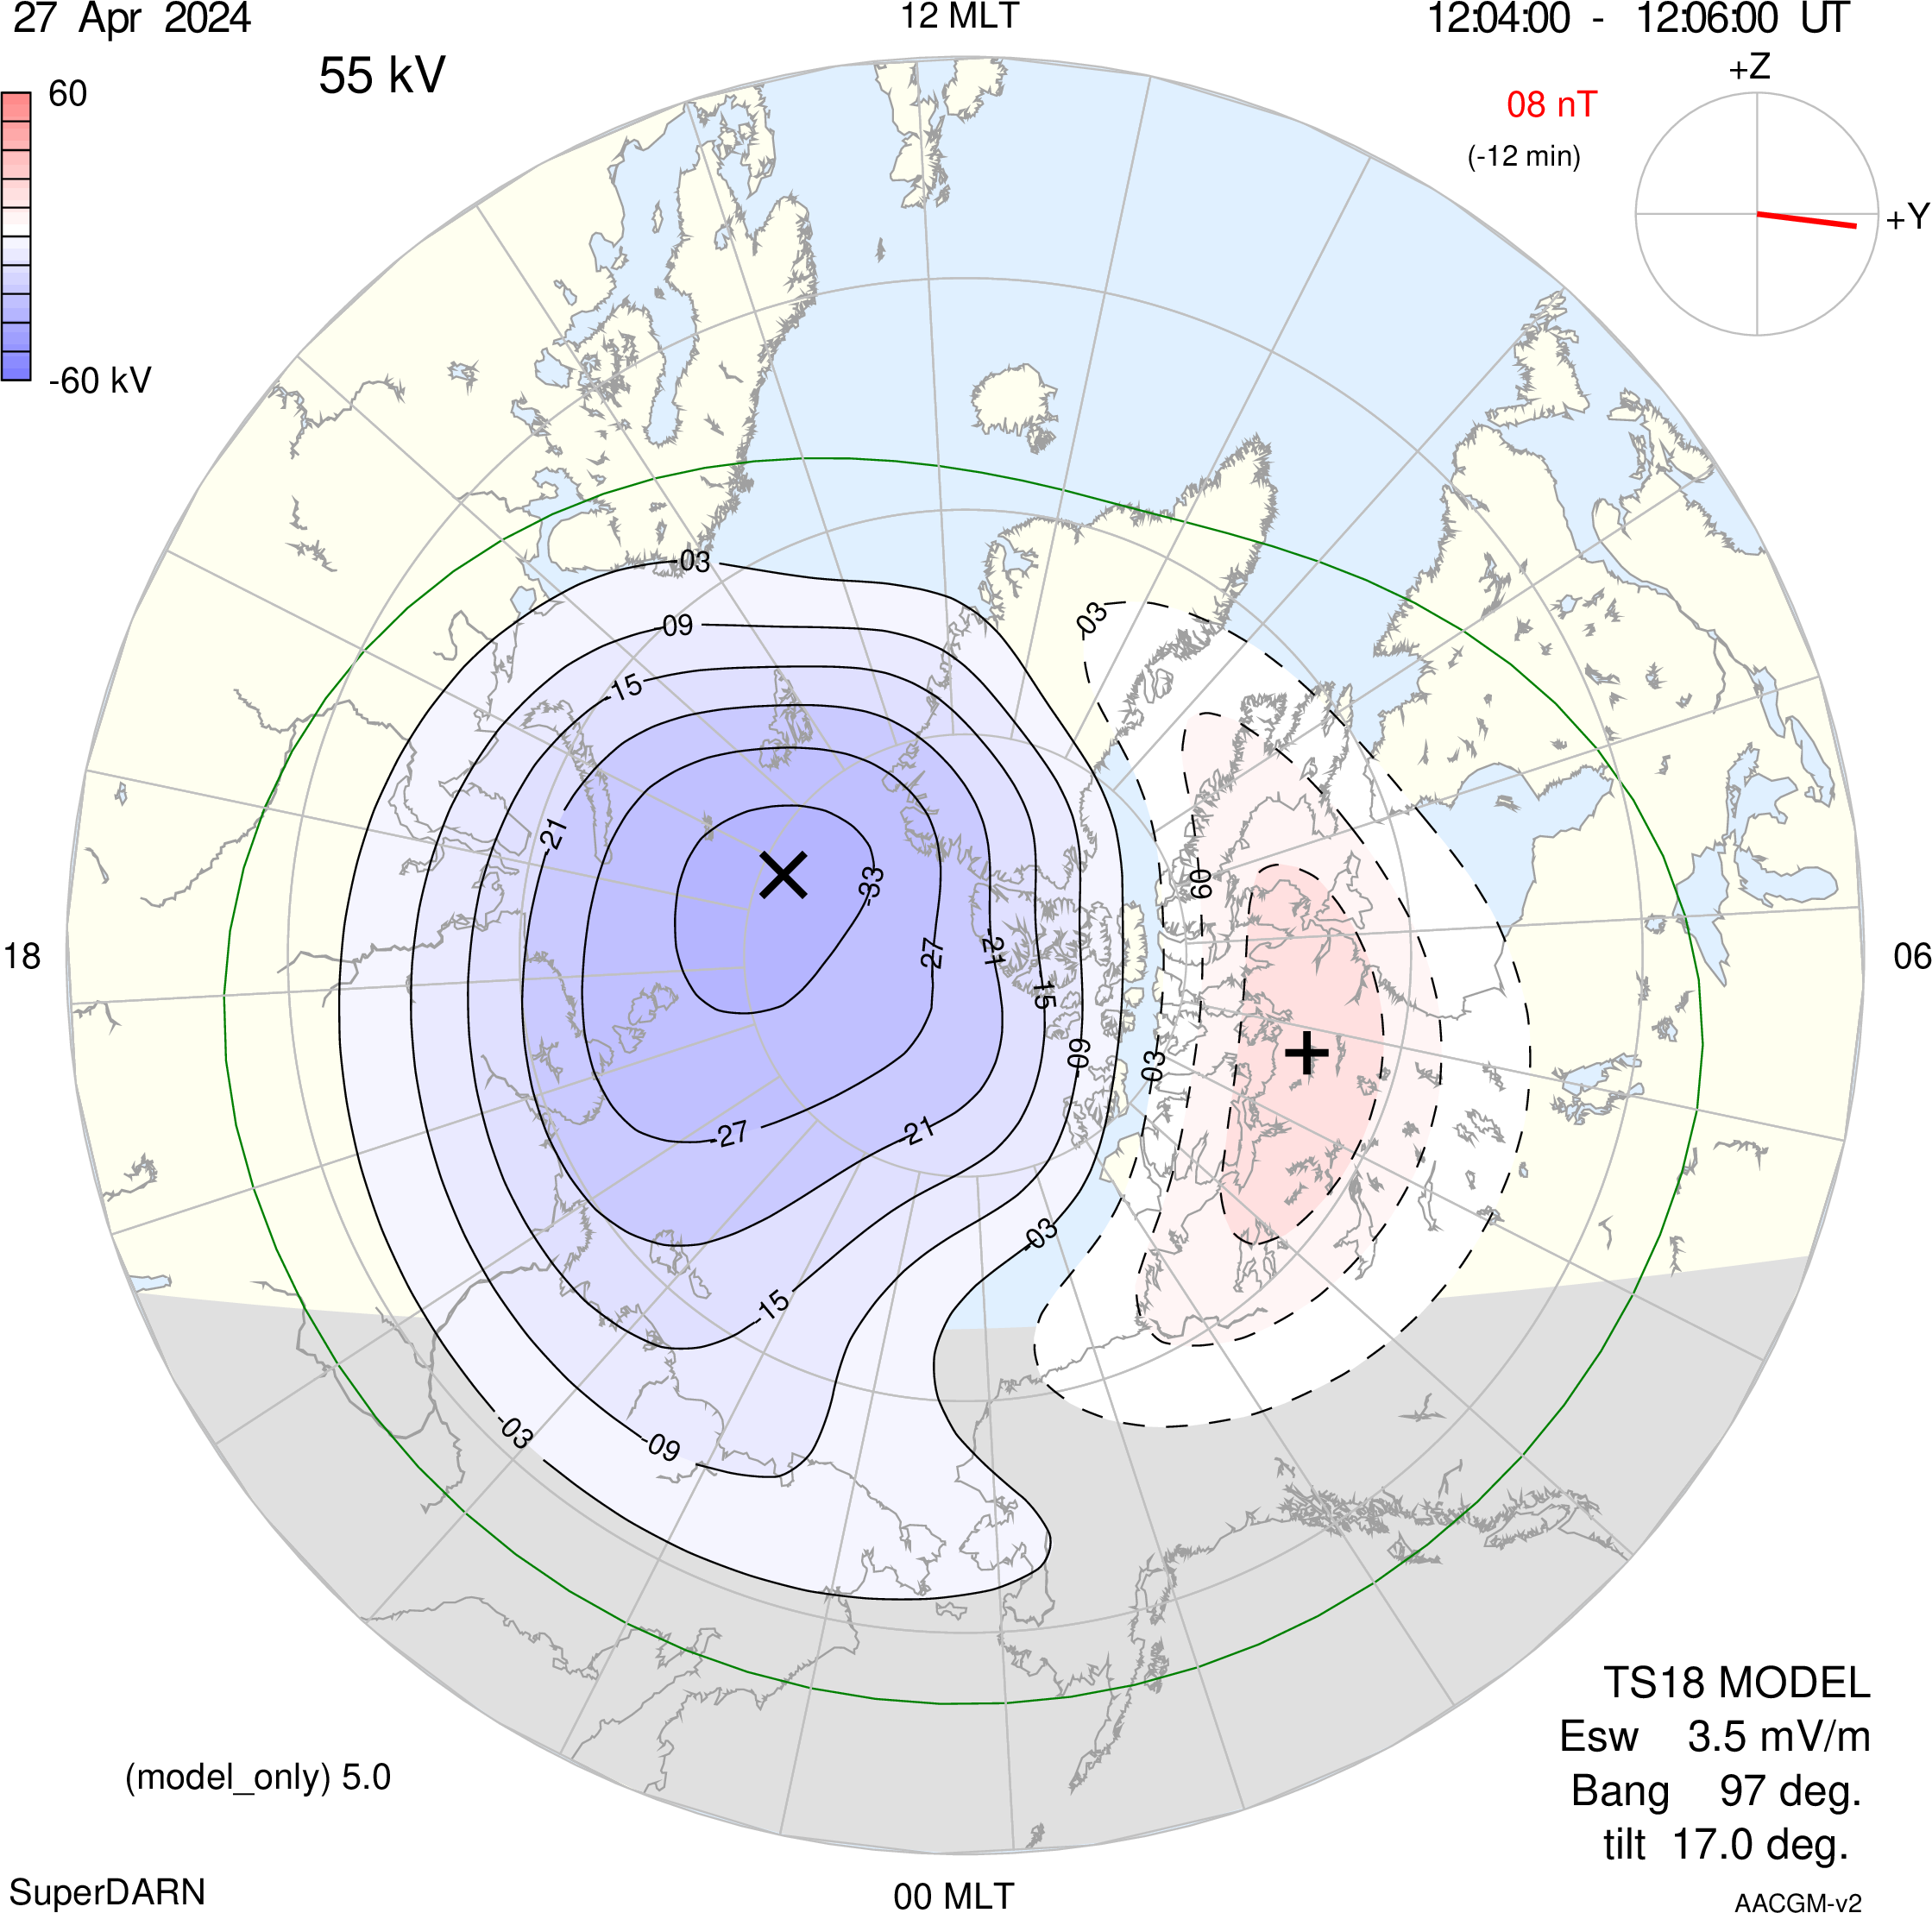
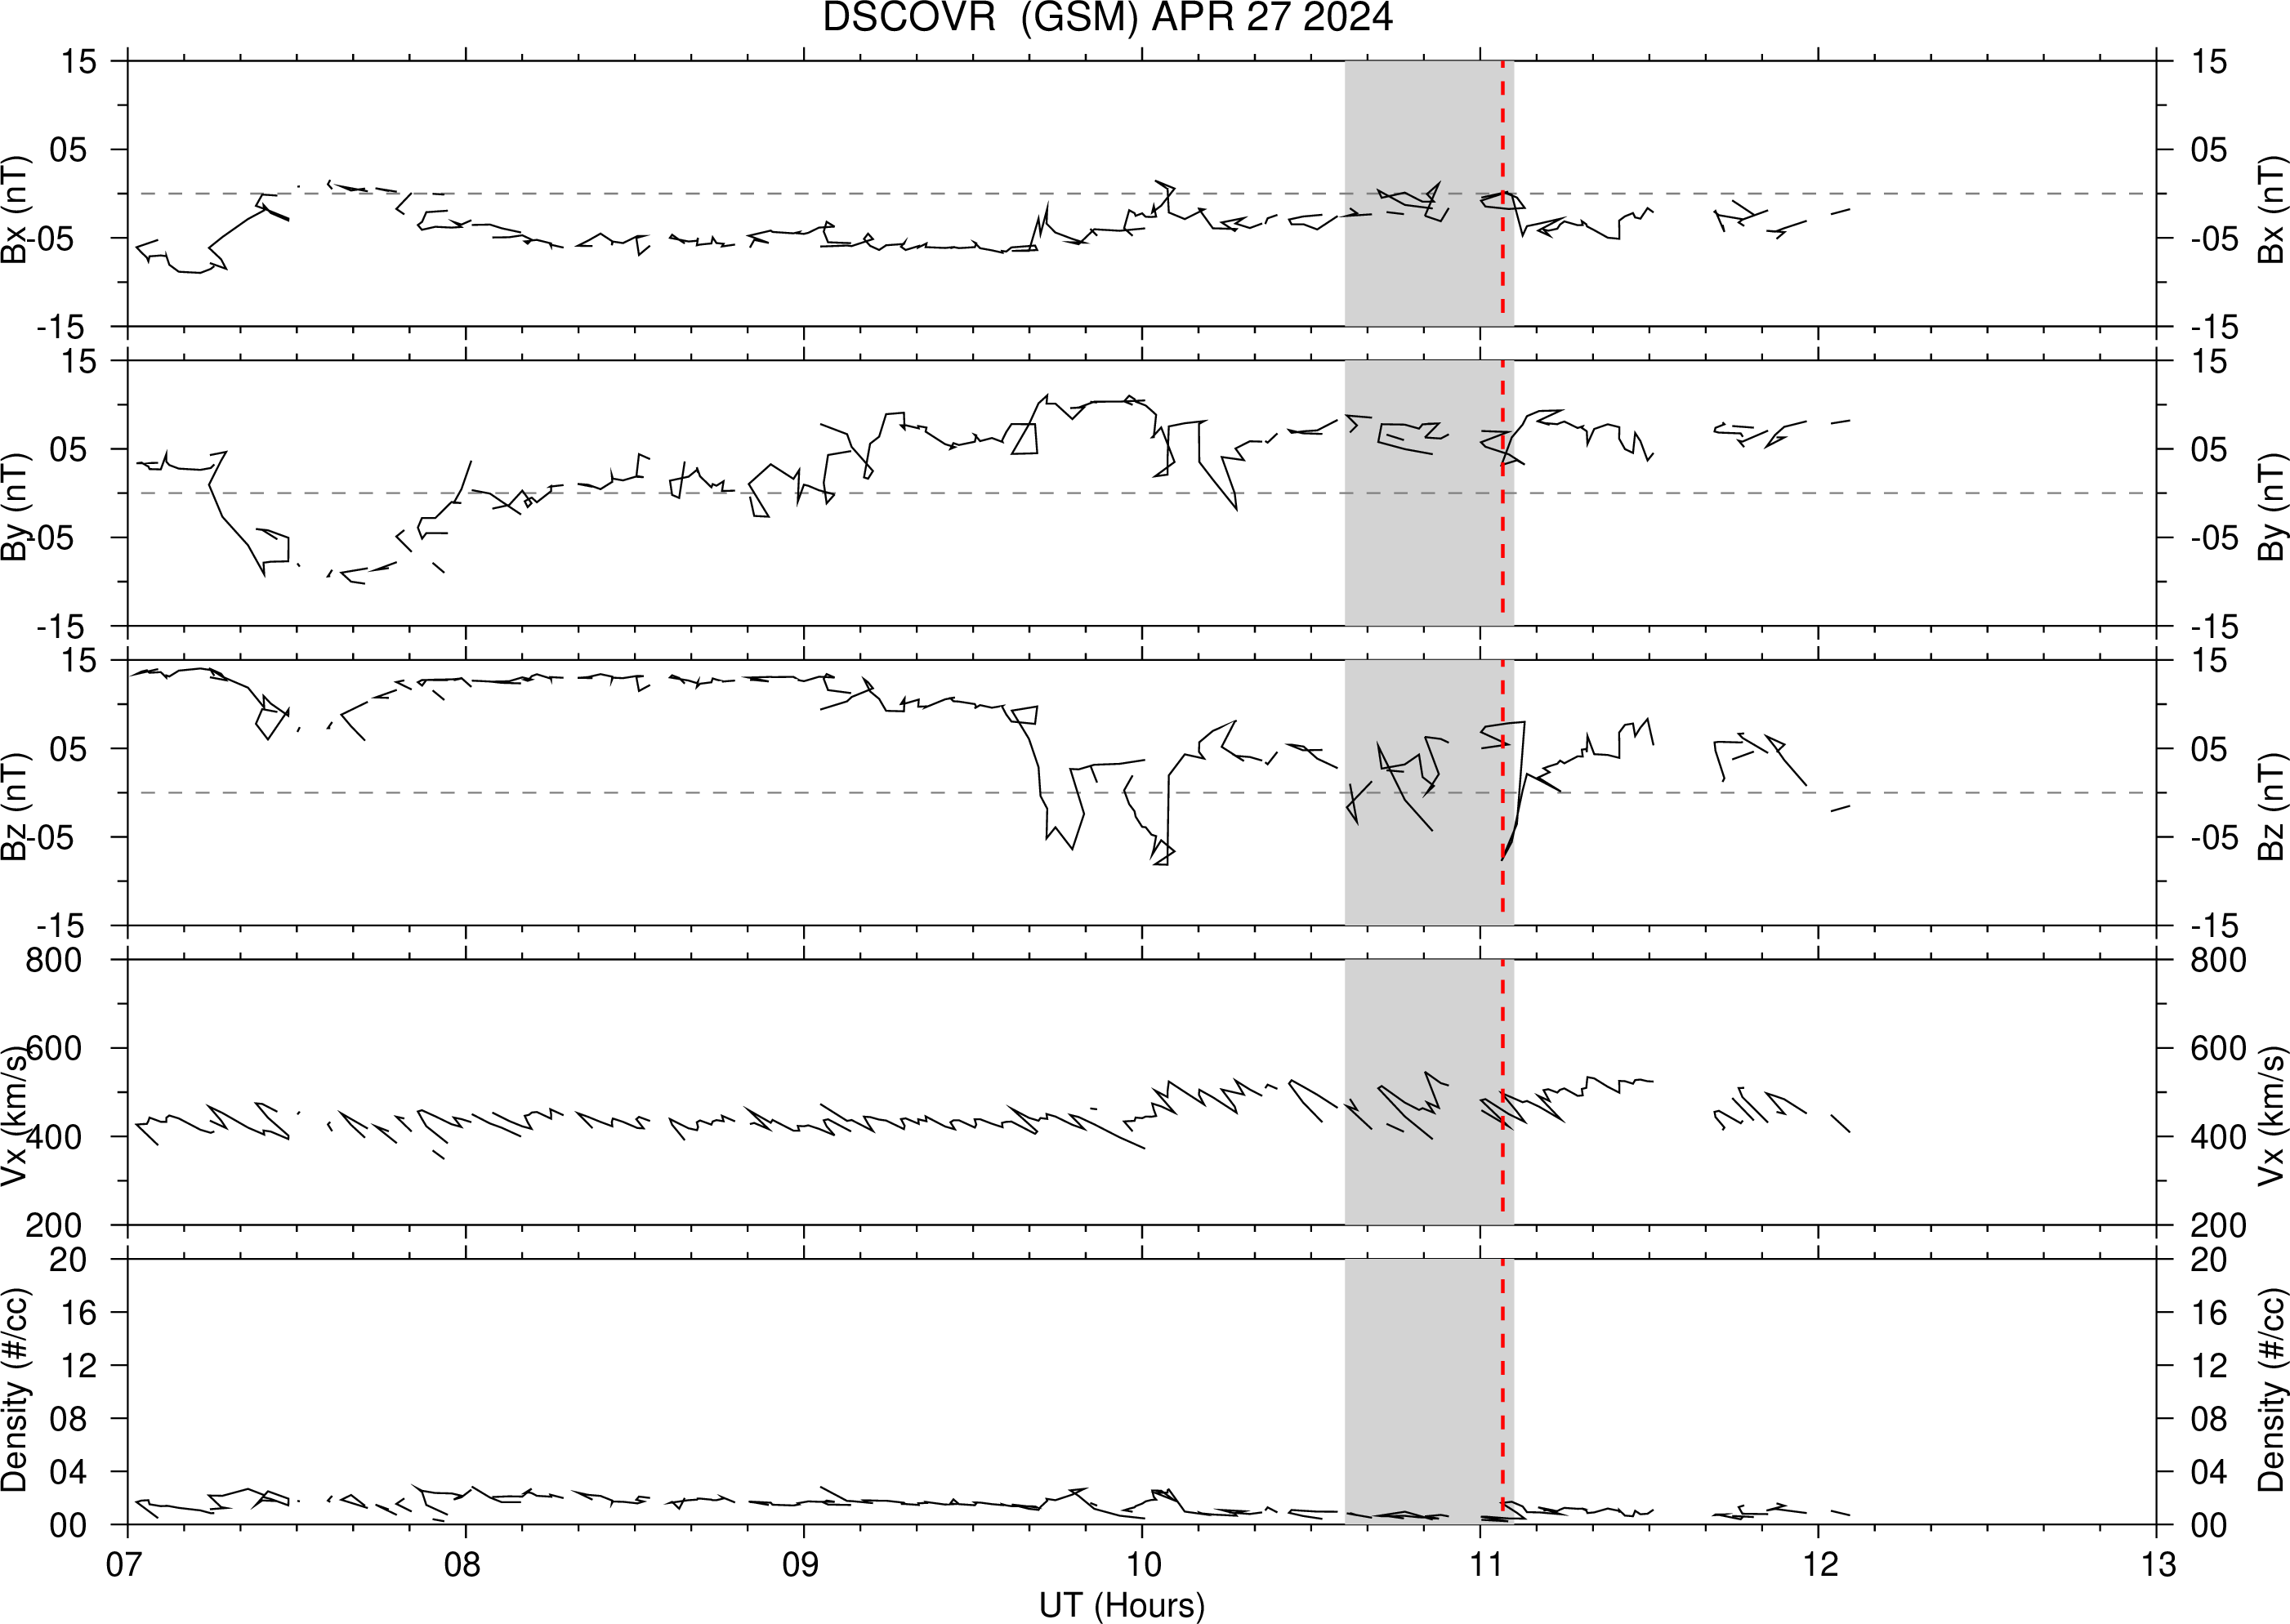
Real-time convection patterns using data from Northern Hemisphere SuperDARN radars and propagated solar wind data from the NOAA Deep Space Climate Observatory (DSCOVR) spacecraft located at the L1 Lagrangian point. On the right, real-time TS18 statistical model predictions are shown for comparison. Note that gaps or anomalies in the DSCOVR data may cause the TS18 convection model to behave unpredictably.
| Real-Time Data | TS18 Model |
 |
 |
| Real-Time Data | TS18 Model |
 |
 |
 |
|
| (Note: A ballistic technique is used by NOAA to propagate the DSCOVR solar wind data from the spacecraft location to 32 Earth radii. We apply an additional 12 minute delay to allow for propagation to the Earth's magnetopause. Gray shaded region corresponds to the 30 min animation interval; vertical dashed line indicates the time of the still frames. IMF Bx and solar wind density values do not contribute to the convection output and are for illustrative purposes only.) | |
SuperDARN Radar Information
Northern Hemisphere
| Site | Institution | geo. lat. | geo. lon. | boresight | mag. lat. | mag. lon. | Start Date | tdiff | X | Y | Z |
| Hejing West hjw |
National Space Science Center | 42.768 | 83.728 | -39.0 | 39.0 | 157.2 | 20230917 | 0.000 | 0.0 | -100.0 | 0.0 |
| Hejing East hje |
National Space Science Center | 42.768 | 83.730 | 39.0 | 39.0 | 157.2 | 20230917 | 0.000 | 0.0 | -100.0 | 0.0 |
| Siziwang West szw |
National Space Science Center | 41.833 | 111.931 | -36.0 | 37.3 | -173.7 | 20221101 | 0.000 | 0.0 | -100.0 | 0.0 |
| Siziwang East sze |
National Space Science Center | 41.833 | 111.934 | 42.0 | 37.3 | -173.7 | 20221101 | 0.000 | 0.0 | -100.0 | 0.0 |
| Longjing West ljw |
National Space Science Center | 42.827 | 129.418 | -34.0 | 37.1 | -156.2 | 20230626 | 0.000 | 0.0 | -75.0 | 0.0 |
| Longjing East lje |
National Space Science Center | 42.824 | 129.422 | 44.0 | 37.1 | -156.2 | 20230626 | 0.000 | 0.0 | -75.0 | 8.6 |
| Jiamusi East jme |
National Space Science Center | 46.767 | 130.486 | 44.0 | 41.2 | -155.1 | 20190625 | 0.000 | 0.0 | -100.0 | 0.0 |
| Hokkaido East hok |
Nagoya University | 43.532 | 143.615 | 30.0 | 36.9 | -143.1 | 20061101 | 0.000 | 0.0 | -100.0 | 2.9 |
| Hokkaido West hkw |
Nagoya University | 43.537 | 143.607 | -30.0 | 36.9 | -143.1 | 20141029 | 0.000 | 0.0 | -100.0 | 2.55 |
| Adak West adw |
Penn State University | 51.893 | -176.631 | -28.0 | 47.3 | -110.8 | 20120906 | -0.421 | 0.0 | -69.85 | 0.0 |
| Adak East ade |
Penn State University | 51.893 | -176.628 | 47.0 | 47.3 | -110.8 | 20120906 | -0.435 | 0.0 | -69.85 | +0.5 |
| Christmas Valley West cvw |
Dartmouth College | 43.271 | -120.359 | -20.0 | 48.6 | -55.9 | 20101104 | -0.351 | 0.0 | -80.0 | 0.0 |
| Christmas Valley East cve |
Dartmouth College | 43.271 | -120.356 | 54.0 | 48.6 | -55.9 | 20101104 | -0.398 | 0.0 | -80.0 | 0.0 |
| Fort Hays West fhw |
Virginia Tech | 38.859 | -99.391 | -25.0 | 47.5 | -29.7 | 20091120 | 0.000 | 0.0 | -80.0 | 0.0 |
| Fort Hays East fhe |
Virginia Tech | 38.859 | -99.388 | 45.0 | 47.5 | -29.7 | 20091120 | 0.000 | 0.0 | -80.0 | 0.0 |
| Blackstone bks |
Virginia Tech | 37.102 | -77.950 | -40.0 | 45.7 | -0.5 | 20080202 | -0.338 | 0.0 | -58.9 | -2.7 |
| Wallops Island wal |
JHU/APL | 37.857 | -75.510 | 35.9 | 46.0 | 2.8 | 20050610 | 0.000 | 0.0 | 100.0 | 0.0 |
| King Salmon ksr |
Penn State University | 58.692 | -156.659 | -20.0 | 57.1 | -96.0 | 20011004 | 0.000 | 0.0 | -100.0 | 0.0 |
| Kodiak kod |
Penn State University | 57.612 | -152.191 | 30.0 | 56.7 | -91.8 | 20000108 | 0.000 | 0.0 | -100.0 | 0.0 |
| Prince George pgr |
University of Saskatchewan | 53.982 | -122.592 | -5.0 | 58.7 | -61.1 | 20000303 | 0.000 | 0.0 | -100.0 | 0.0 |
| Saskatoon sas |
University of Saskatchewan | 52.158 | -106.530 | 23.1 | 59.6 | -40.7 | 19930929 | 0.000 | 0.0 | -100.0 | 0.0 |
| Kapuskasing kap |
Virginia Tech | 49.392 | -82.322 | -12.0 | 58.0 | -6.1 | 19930901 | 0.043 | 0.0 | 100.0 | -2.0 |
| Goose Bay gbr |
Virginia Tech | 53.318 | -60.464 | 5.0 | 58.6 | 23.1 | 19831001 | 0.478 | 1.5 | 100.0 | 0.0 |
| Stokkseyri sto |
Lancaster University | 63.860 | -21.032 | -59.0 | 63.5 | 64.1 | 19940601 | 0.000 | 0.0 | -100.0 | 0.0 |
| Pykkvibaer pyk |
University of Leicester | 63.773 | -20.545 | 30.0 | 63.3 | 64.4 | 19951120 | -0.083 | 0.0 | 100.0 | 0.0 |
| Iceland West icw |
Dartmouth College | 63.774 | -20.546 | -52.0 | 63.3 | 64.4 | 20230124 | -0.415 | 0.0 | -80.0 | 0.0 |
| Iceland East ice |
Dartmouth College | 63.774 | -20.542 | 23.0 | 63.3 | 64.4 | 20230124 | -0.335 | 0.0 | -80.0 | 0.0 |
| Hankasalmi han |
University of Leicester | 62.314 | 26.606 | -12.0 | 59.2 | 102.9 | 19950222 | 0.181 | 0.0 | 185.0 | -2.2 |
| Longyearbyen lyr |
University Centre in Svalbard | 78.153 | 16.073 | 23.7 | 75.8 | 106.6 | 20161019 | 0.000 | 0.0 | -100.1 | 8.1 |
| Clyde River cly |
University of Saskatchewan | 70.486 | -68.504 | -55.62 | 76.9 | 16.8 | 20120806 | 0.000 | 0.0 | 100.0 | 0.0 |
| Inuvik inv |
University of Saskatchewan | 68.413 | -133.769 | 29.5 | 70.9 | -79.9 | 20080101 | 0.000 | 1.5 | 100.0 | 0.0 |
| Rankin Inlet rkn |
University of Saskatchewan | 62.828 | -92.113 | 5.7 | 70.8 | -21.5 | 20070501 | 0.000 | 0.0 | -100.0 | 0.0 |
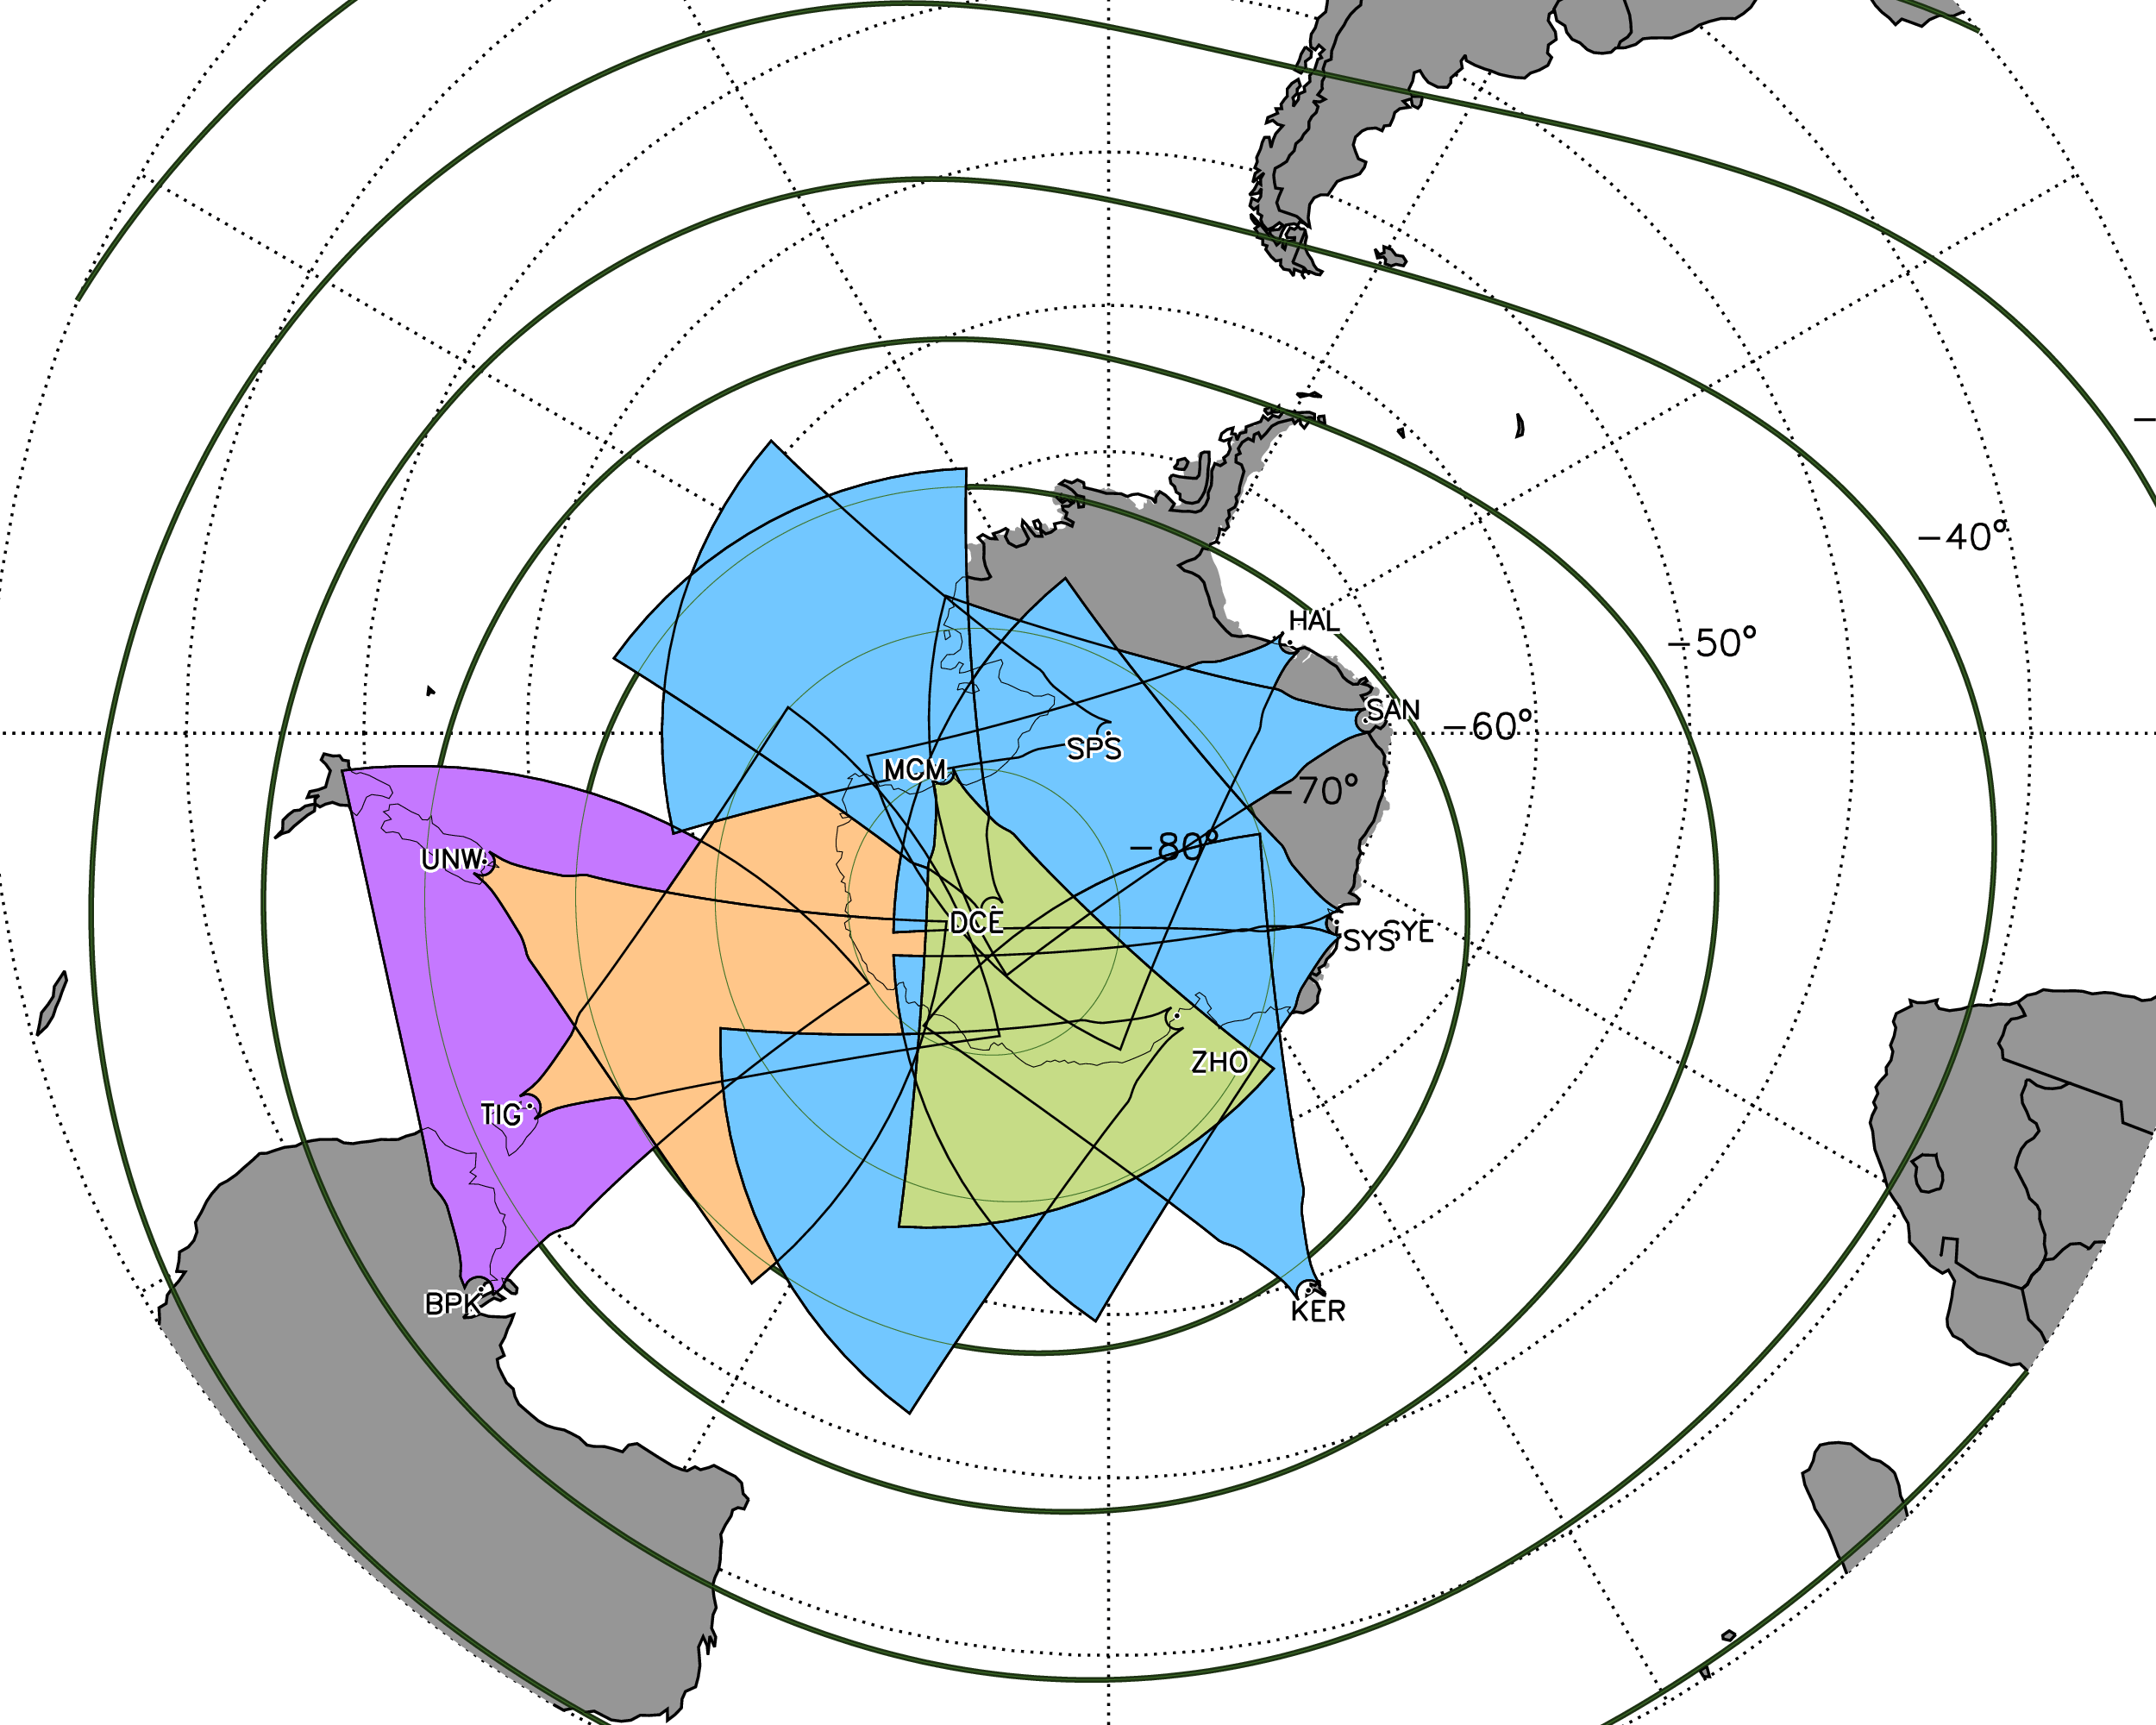
Southern Hemisphere
| Site | Institution | geo. lat. | geo. lon. | boresight | mag. lat. | mag. lon. | Start Date | tdiff | X | Y | Z |
| Buckland Park bpk |
La Trobe University | -34.627 | 138.466 | 146.5 | -45.2 | -145.4 | 20141201 | 0.000 | 0.0 | -80.0 | 0.0 |
| TIGER tig |
La Trobe University | -43.400 | 147.216 | 180.0 | -54.0 | -132.4 | 19991202 | 0.000 | 0.0 | -100.0 | 0.0 |
| Unwin unw |
La Trobe University | -46.513 | 168.376 | 227.9 | -53.8 | -105.2 | 20041101 | 0.000 | 0.0 | -100.0 | 0.0 |
| South Pole Station sps |
Penn State University | -89.995 | 118.291 | 75.7 | -74.4 | 18.8 | 20130122 | 0.025 | 0.0 | 97.5 | 0.0 |
| Halley hal |
British Antarctic Survey | -75.620 | -26.219 | 165.0 | -62.5 | 30.4 | 19880101 | 0.000 | 0.0 | 0.0 | 0.0 |
| SANAE san |
SANSA/University of KwaZulu-Natal | -71.677 | -2.828 | 173.2 | -62.0 | 45.2 | 19970302 | -0.055 | 0.0 | -100.0 | 0.0 |
| Syowa East sye |
NIPR | -69.008 | 39.599 | 106.5 | -66.5 | 73.5 | 19970208 | 0.000 | -5.0 | 92.0 | 0.8 |
| Syowa South sys |
NIPR | -69.010 | 39.589 | 159.0 | -66.5 | 73.5 | 19950201 | 0.000 | -5.0 | 92.0 | 0.8 |
| Kerguelen ker |
IRAP/CNRS | -49.351 | 70.267 | 168.0 | -58.5 | 124.4 | 20000601 | 0.000 | 0 | -89.6 | 0.0 |
| Dome C East dce |
IAPS-INAF | -75.090 | 123.351 | 115.0 | -89.1 | 54.8 | 20120112 | -0.151 | 0.0 | -90.0 | 0.0 |
| Dome C North dcn |
IAPS-INAF | -75.086 | 123.360 | -28.0 | -89.1 | 54.8 | 20130123 | -0.162 | 0.0 | -90.0 | 0.0 |
| Zhongshan Station zho |
Polar Research Institute of China | -69.377 | 76.366 | 72.5 | -74.9 | 98.9 | 20100401 | -0.180 | -27.6 | 100.1 | -5.3 |
| McMurdo mcm |
Penn State University | -77.838 | 166.657 | 263.4 | -79.9 | -33.7 | 20100122 | 0.039 | 0.0 | 70.1 | -4.1 |
| Falkland Islands fir |
British Antarctic Survey | -51.831 | -58.979 | 178.3 | -40.1 | 9.8 | 20100214 | 0.000 | 0.000 | 0.000 | 0.000 |