Yearly Schedule Overview

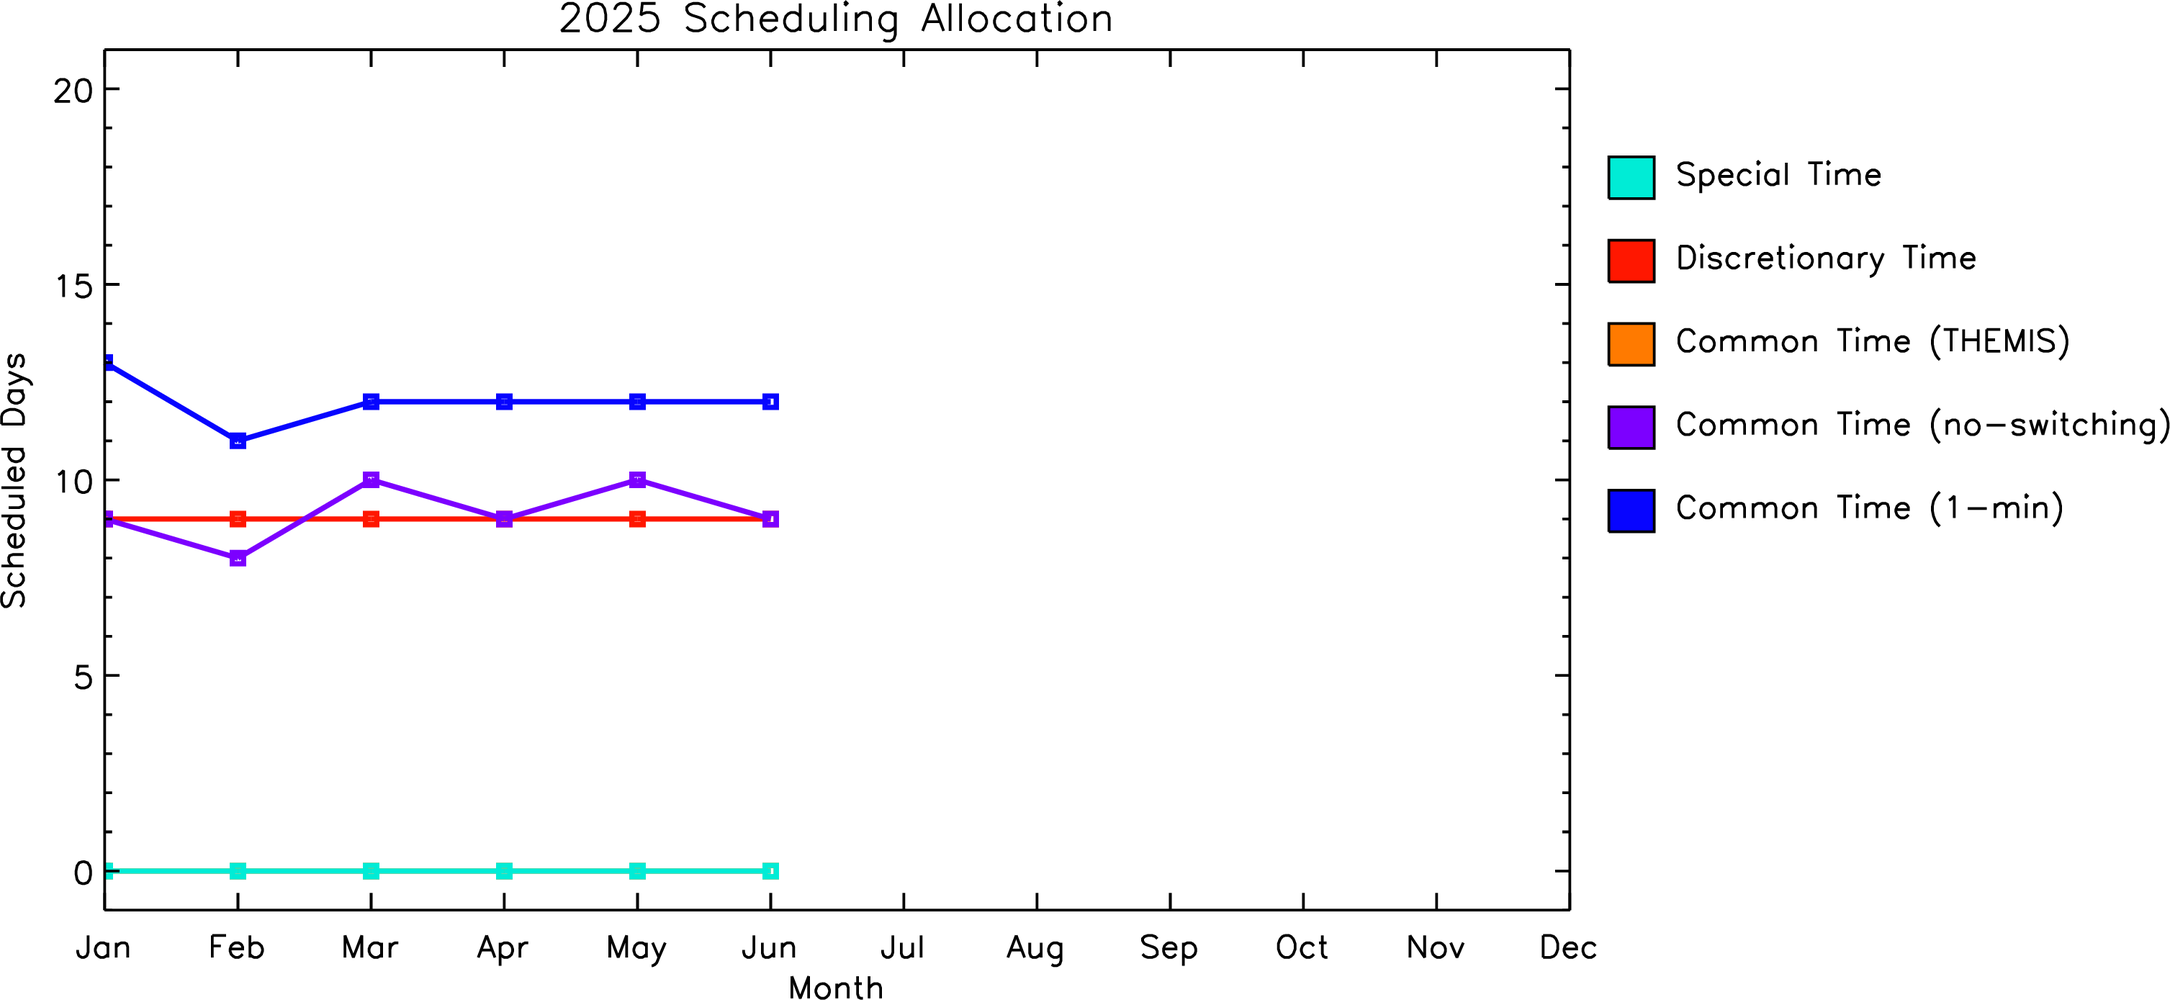
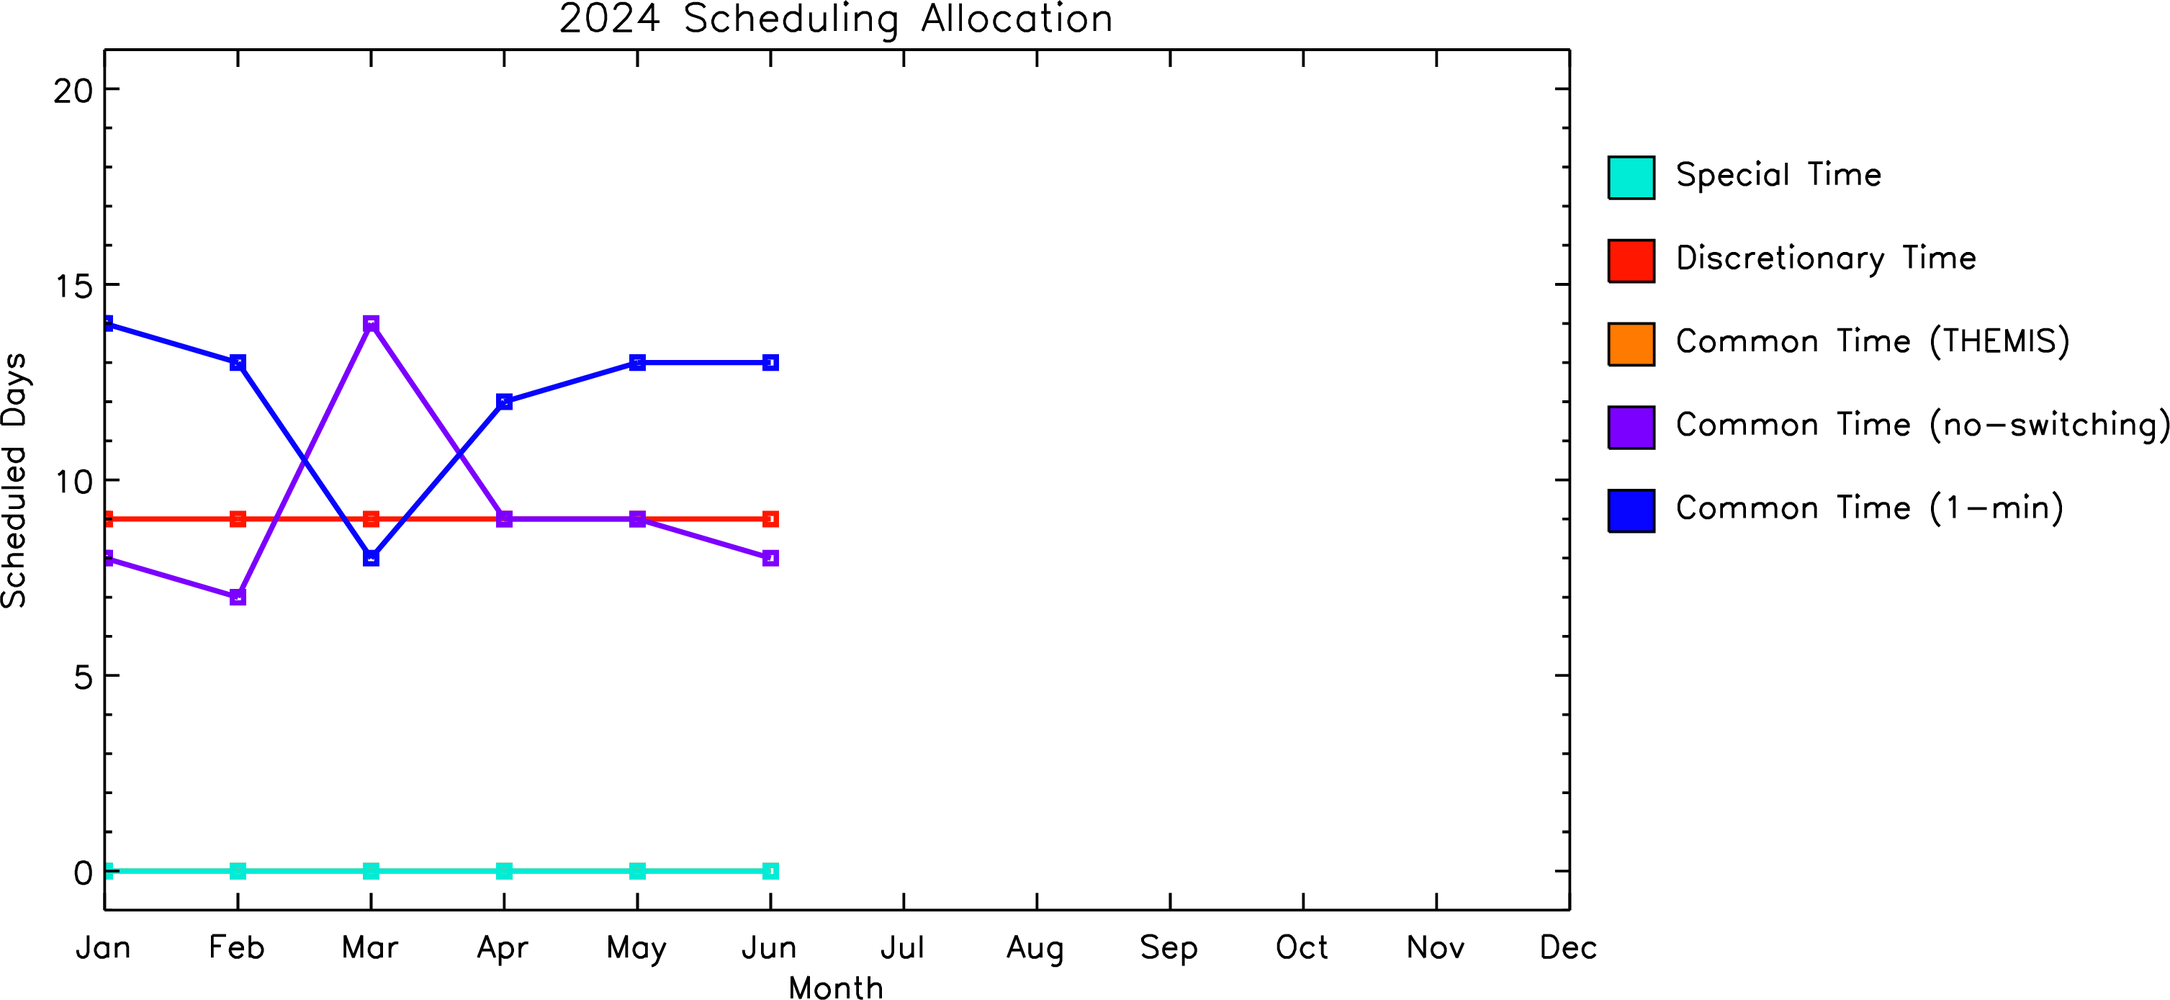
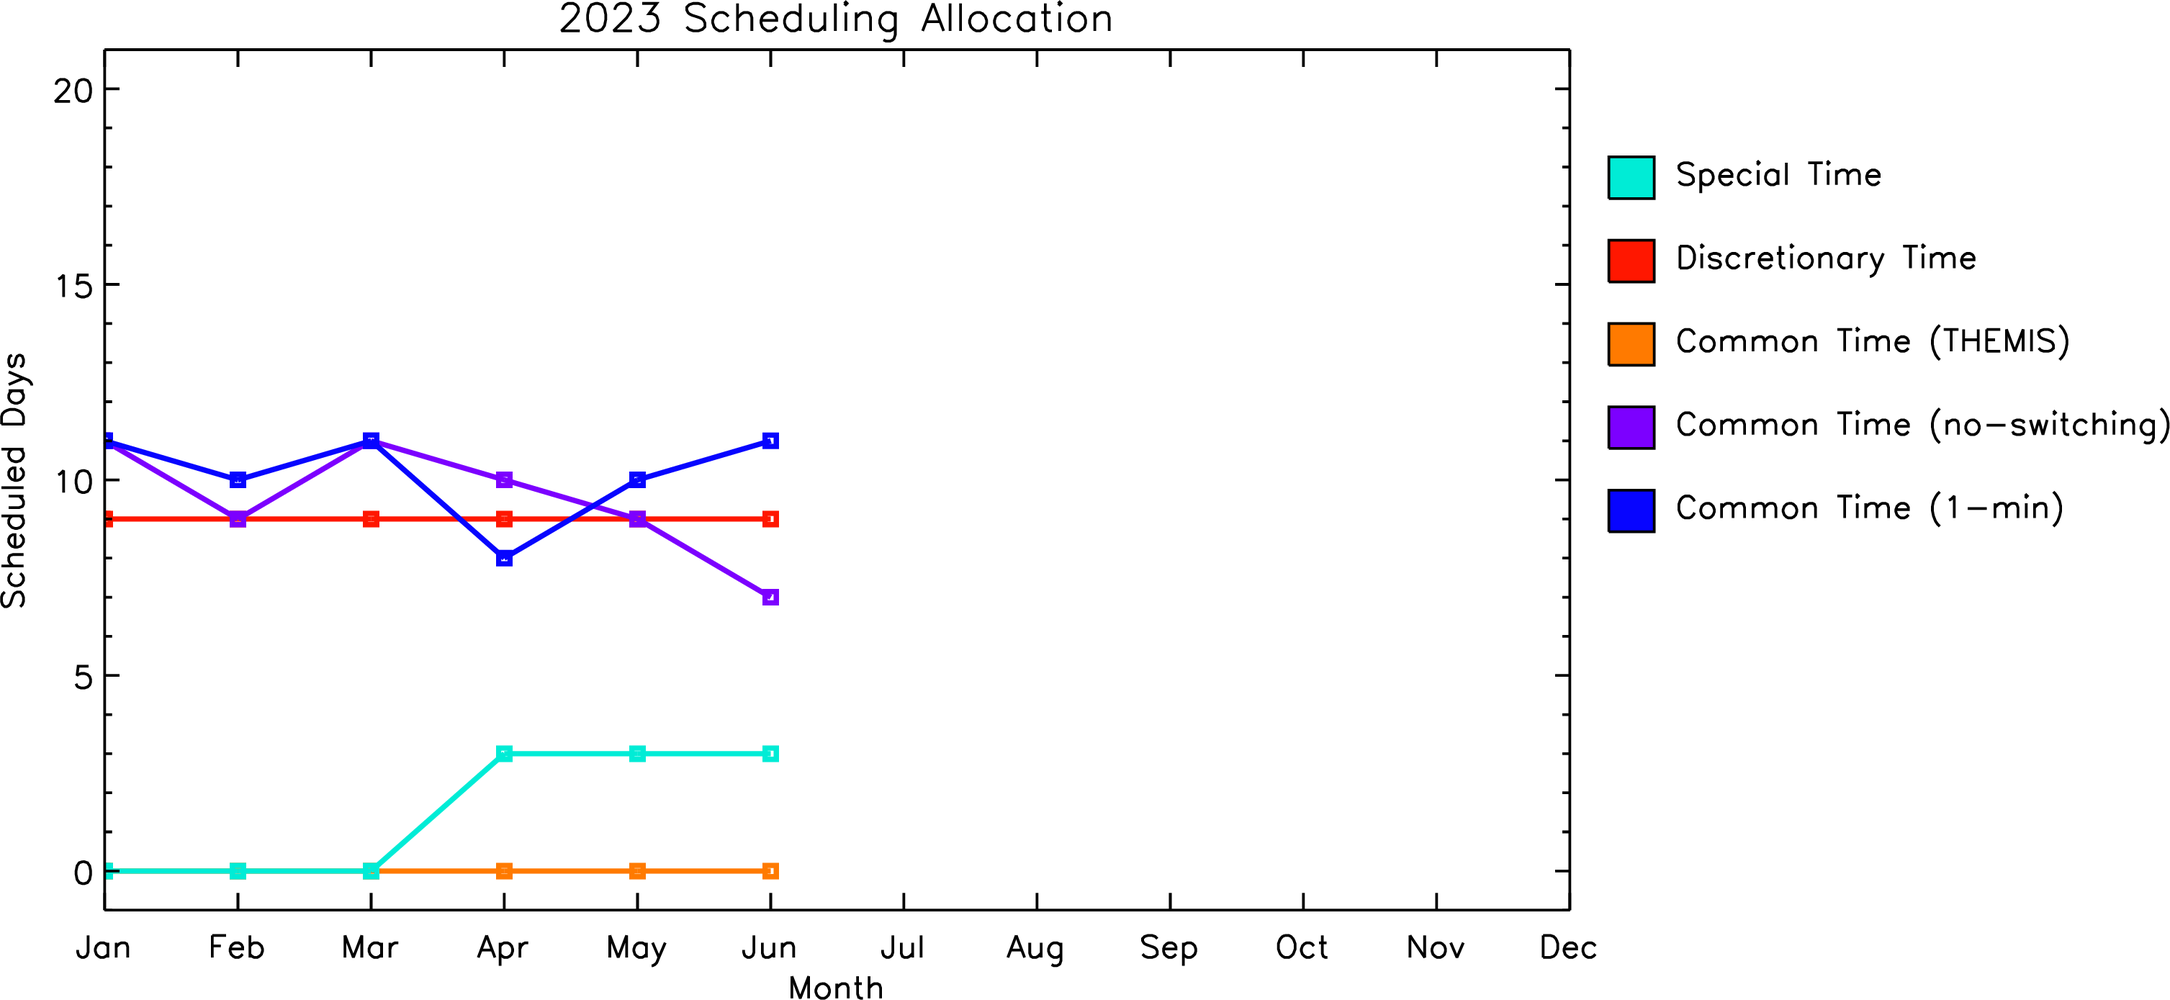
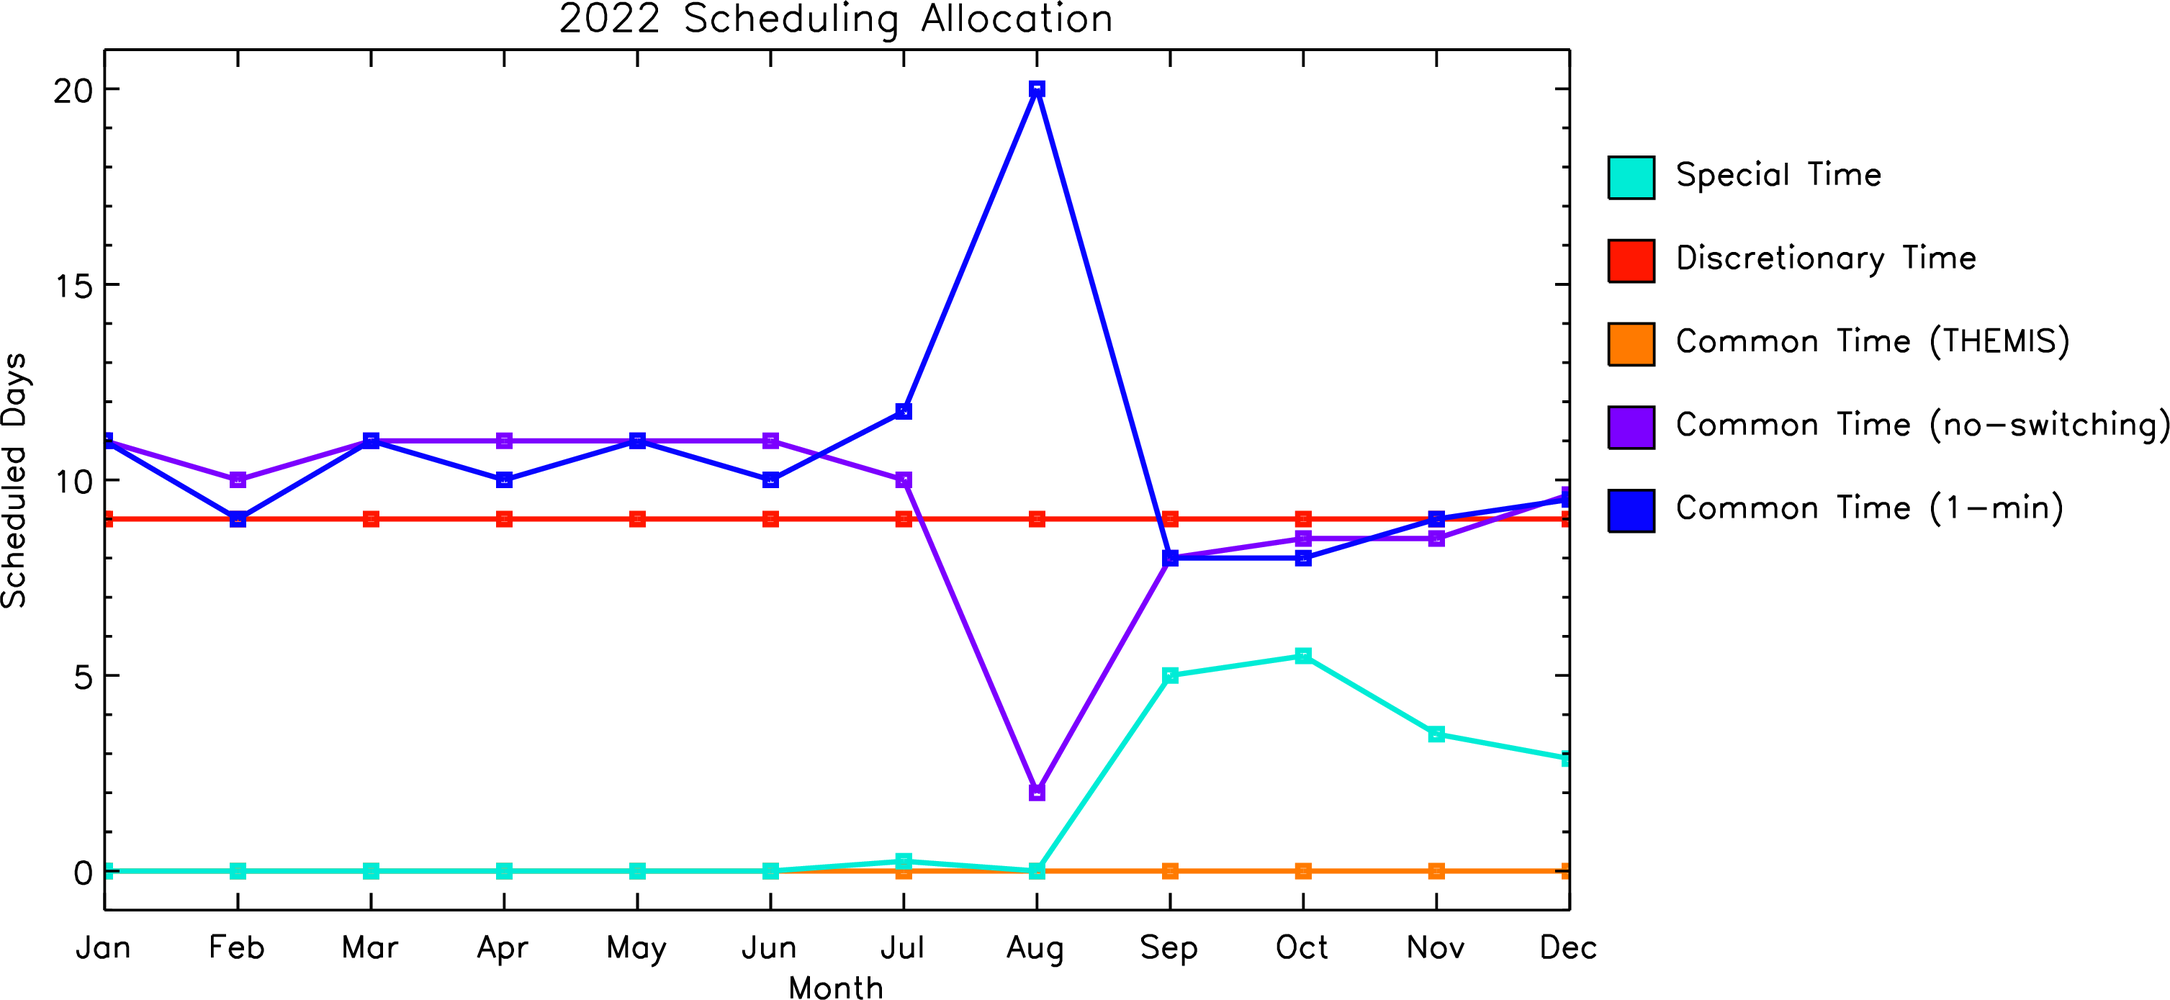
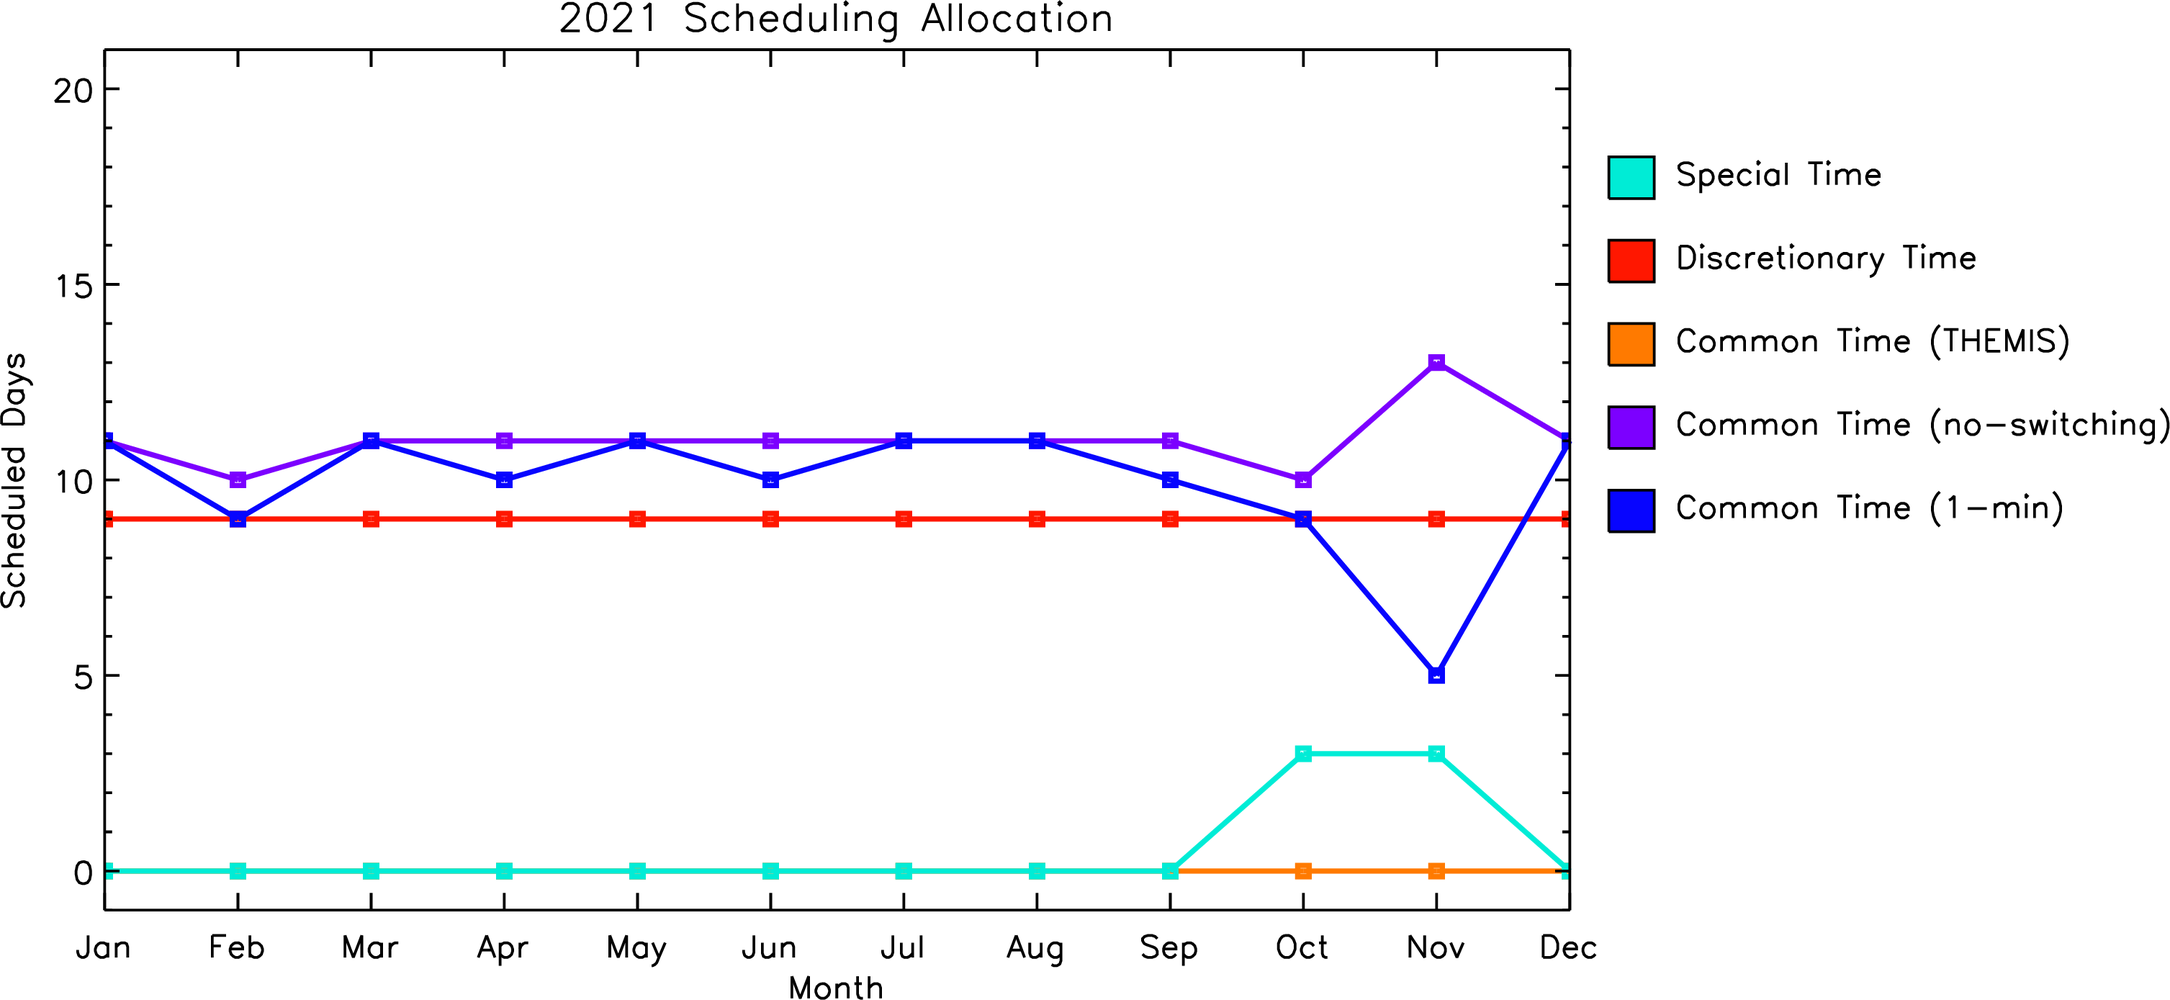
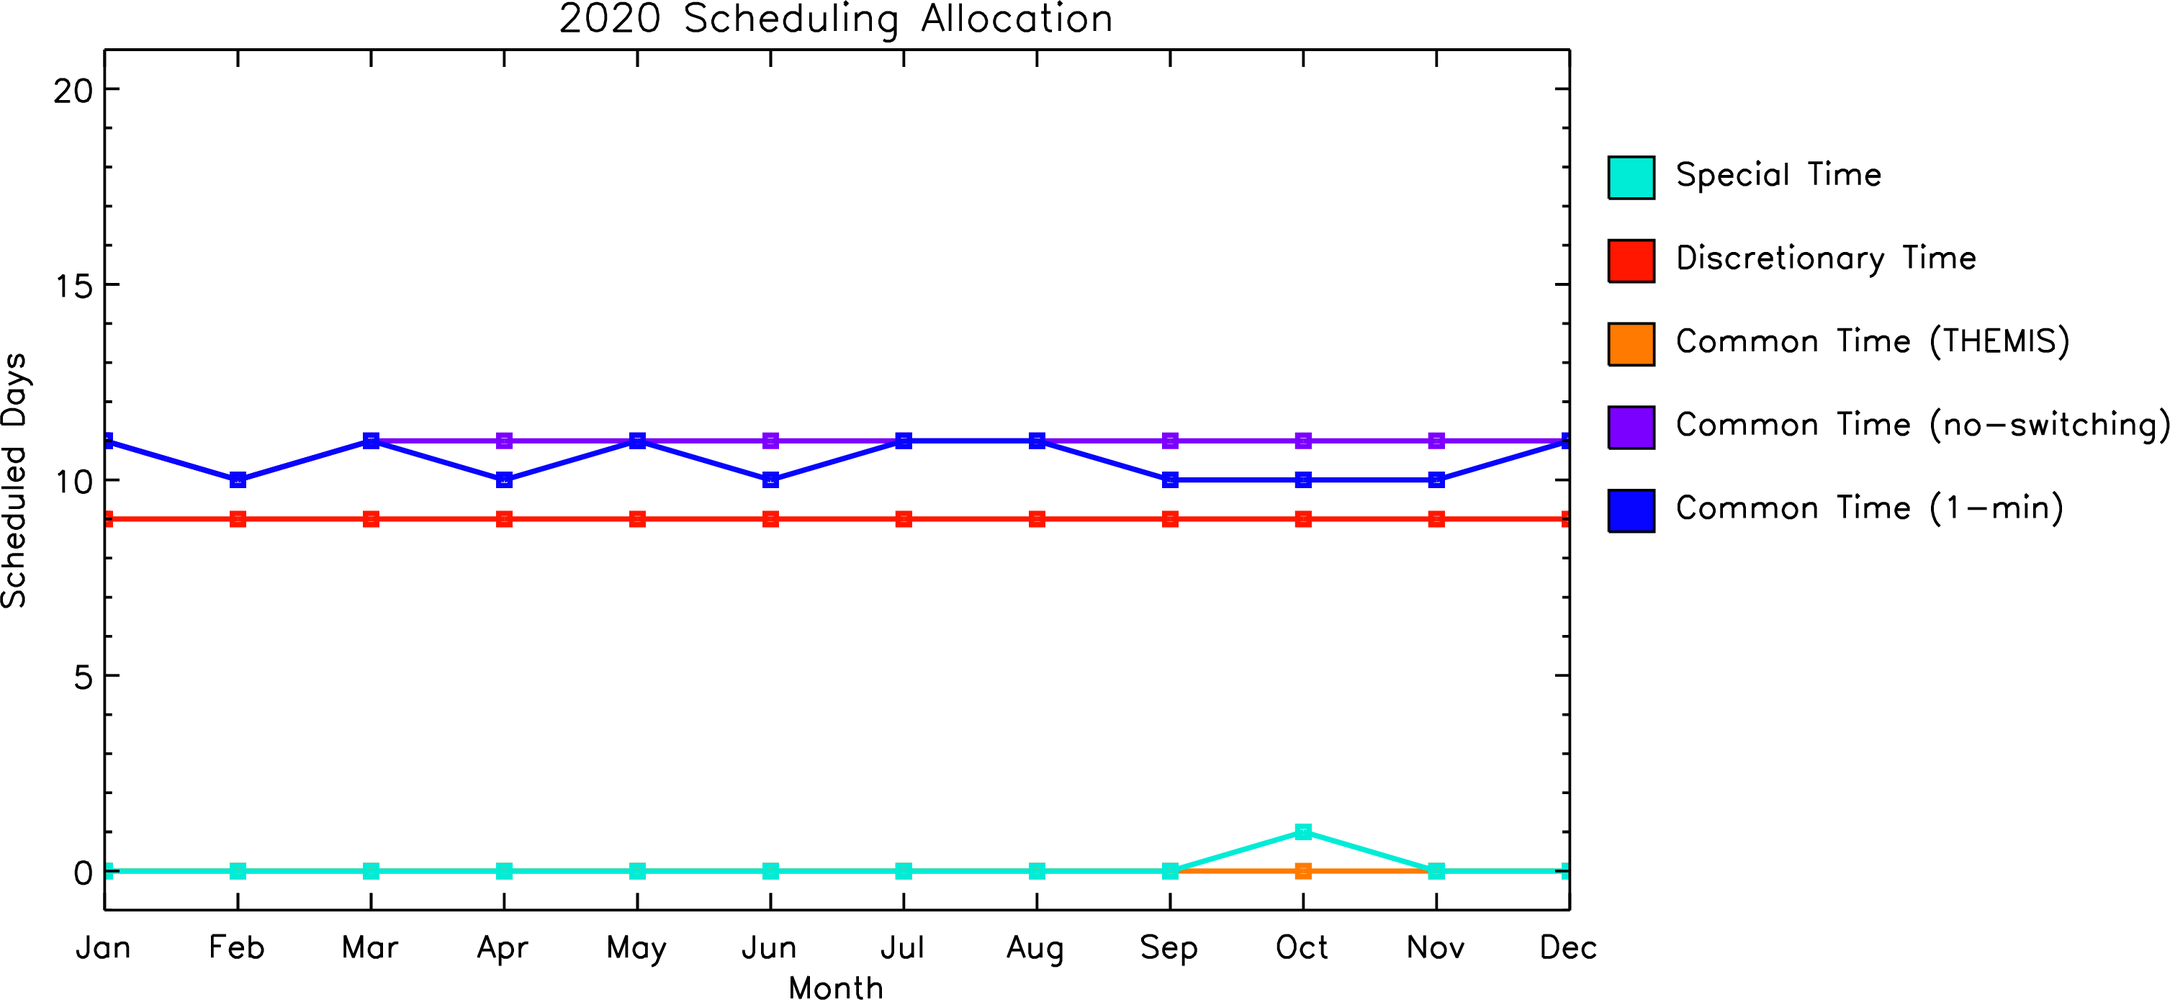
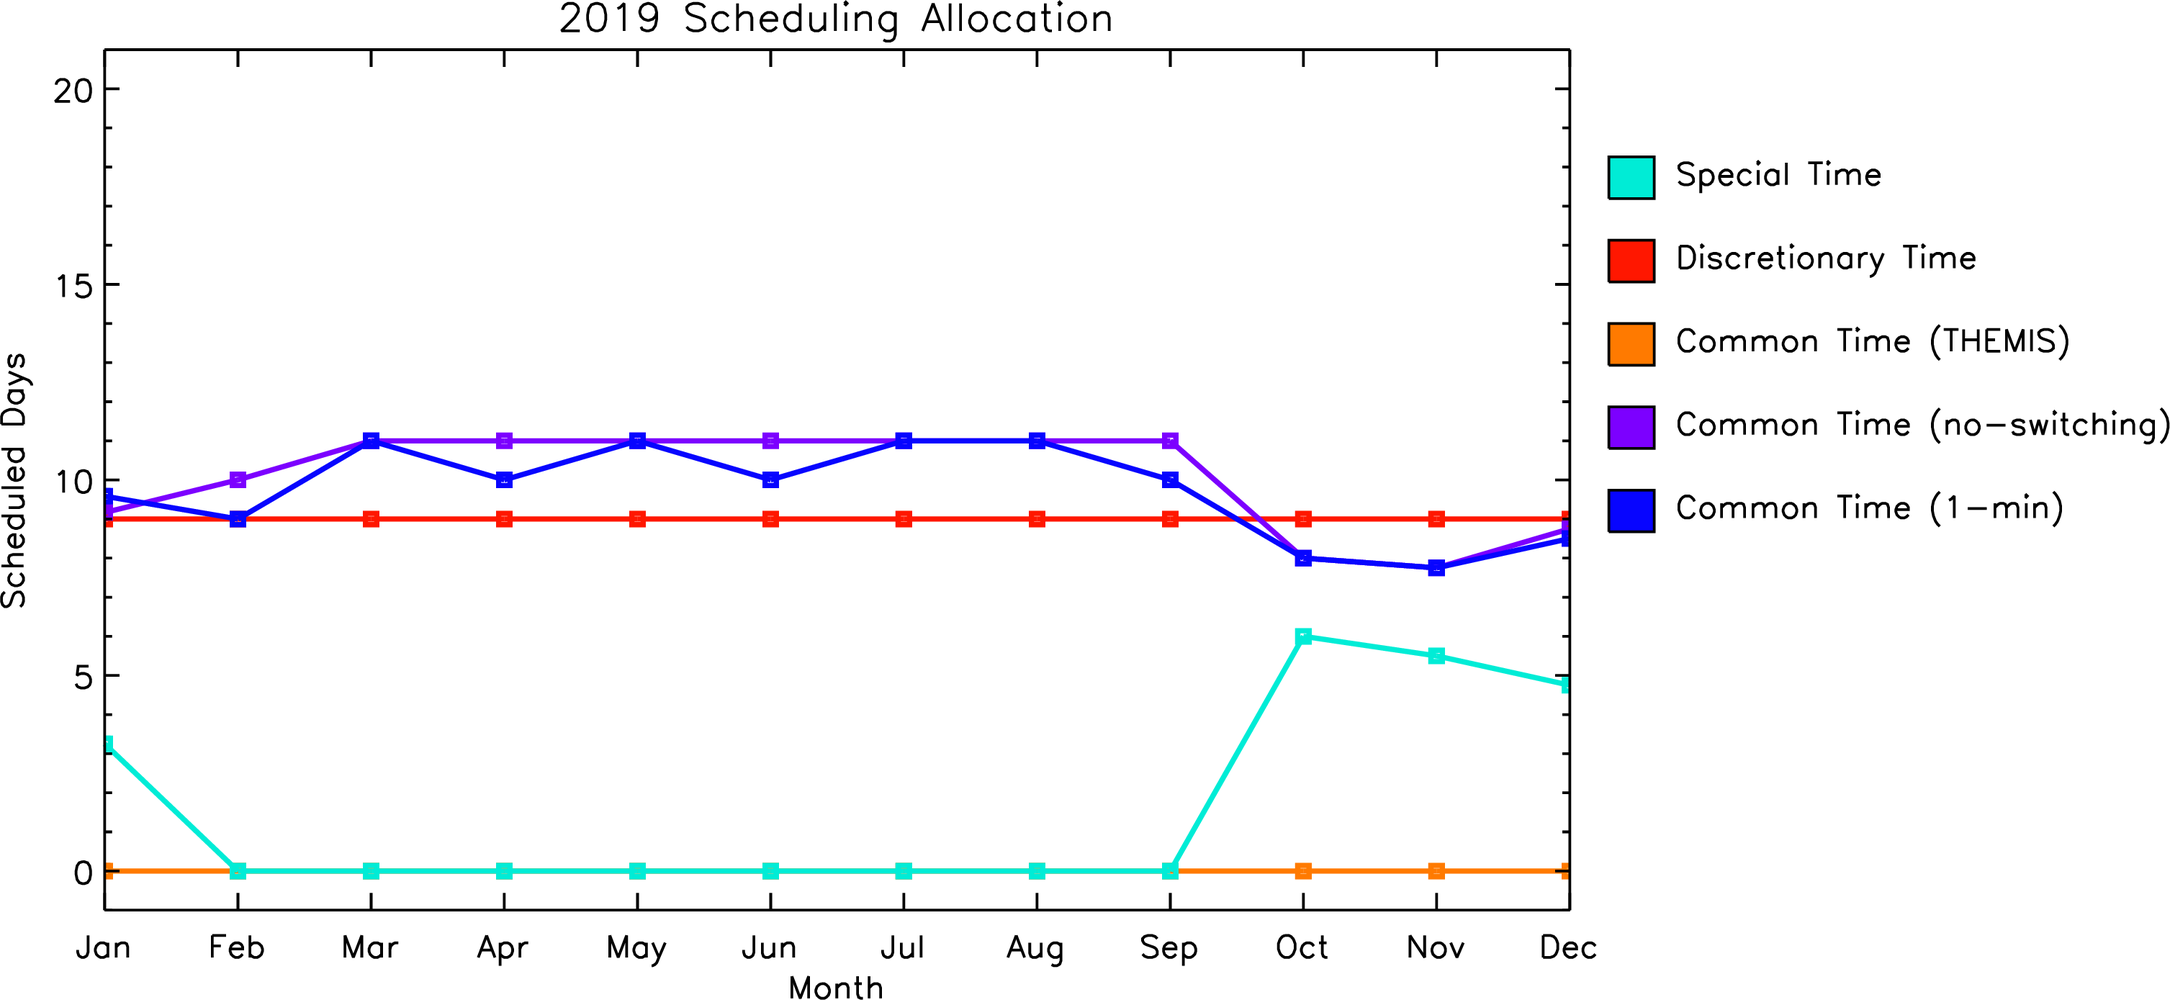
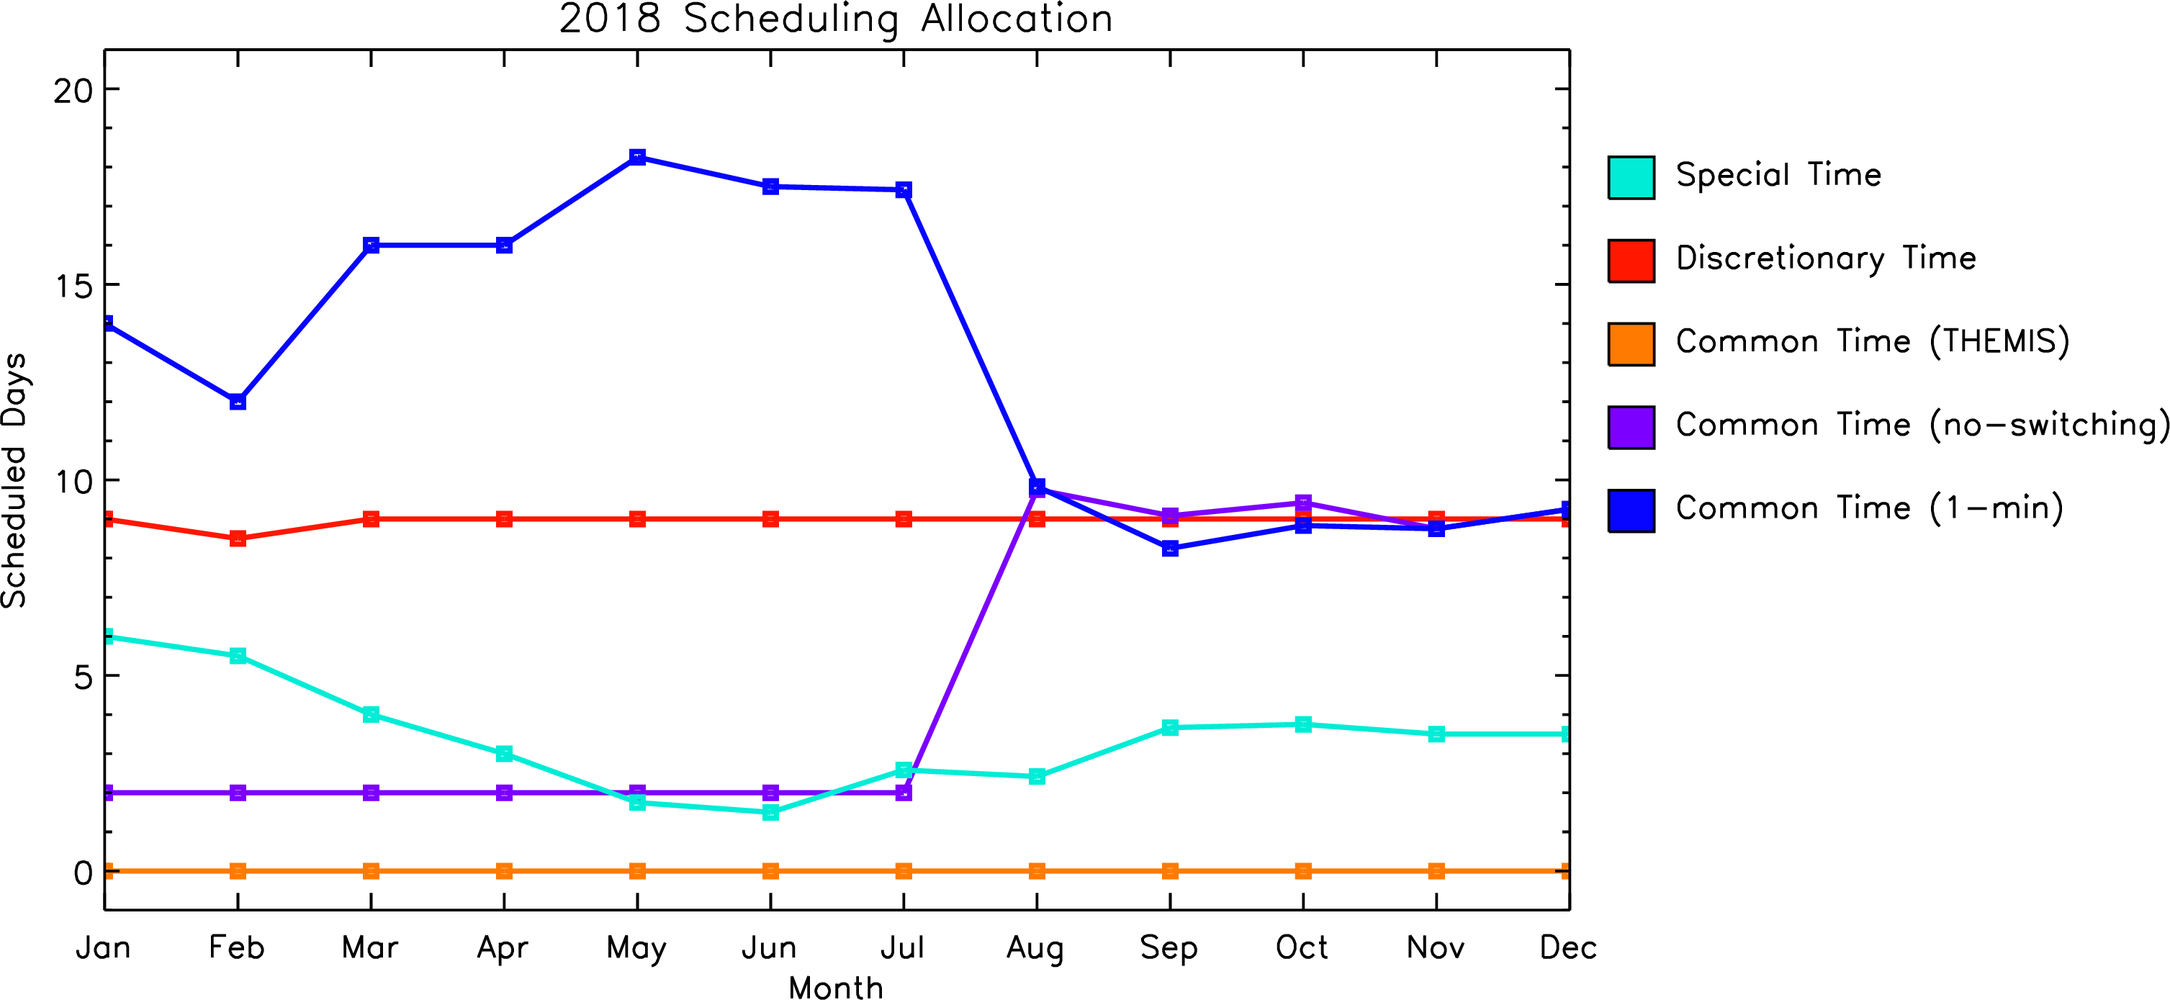
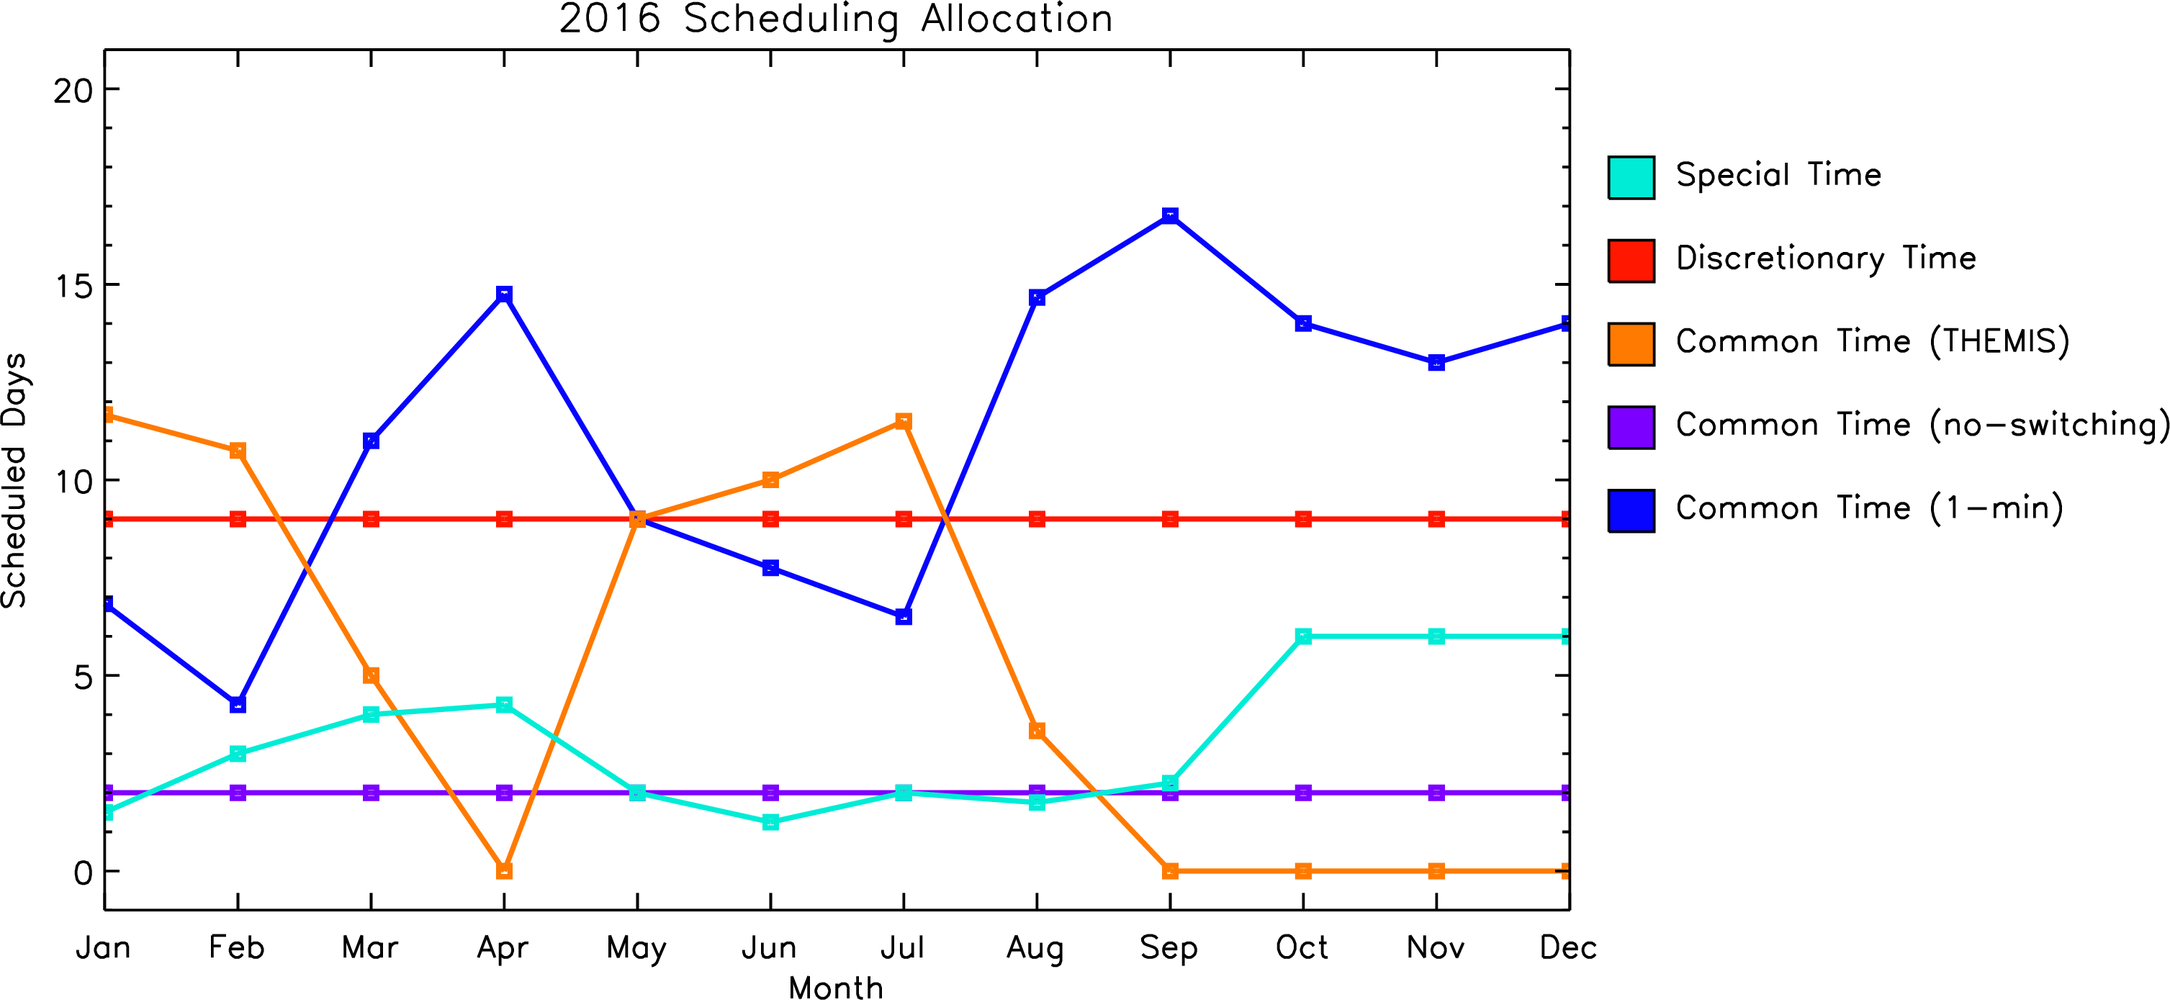
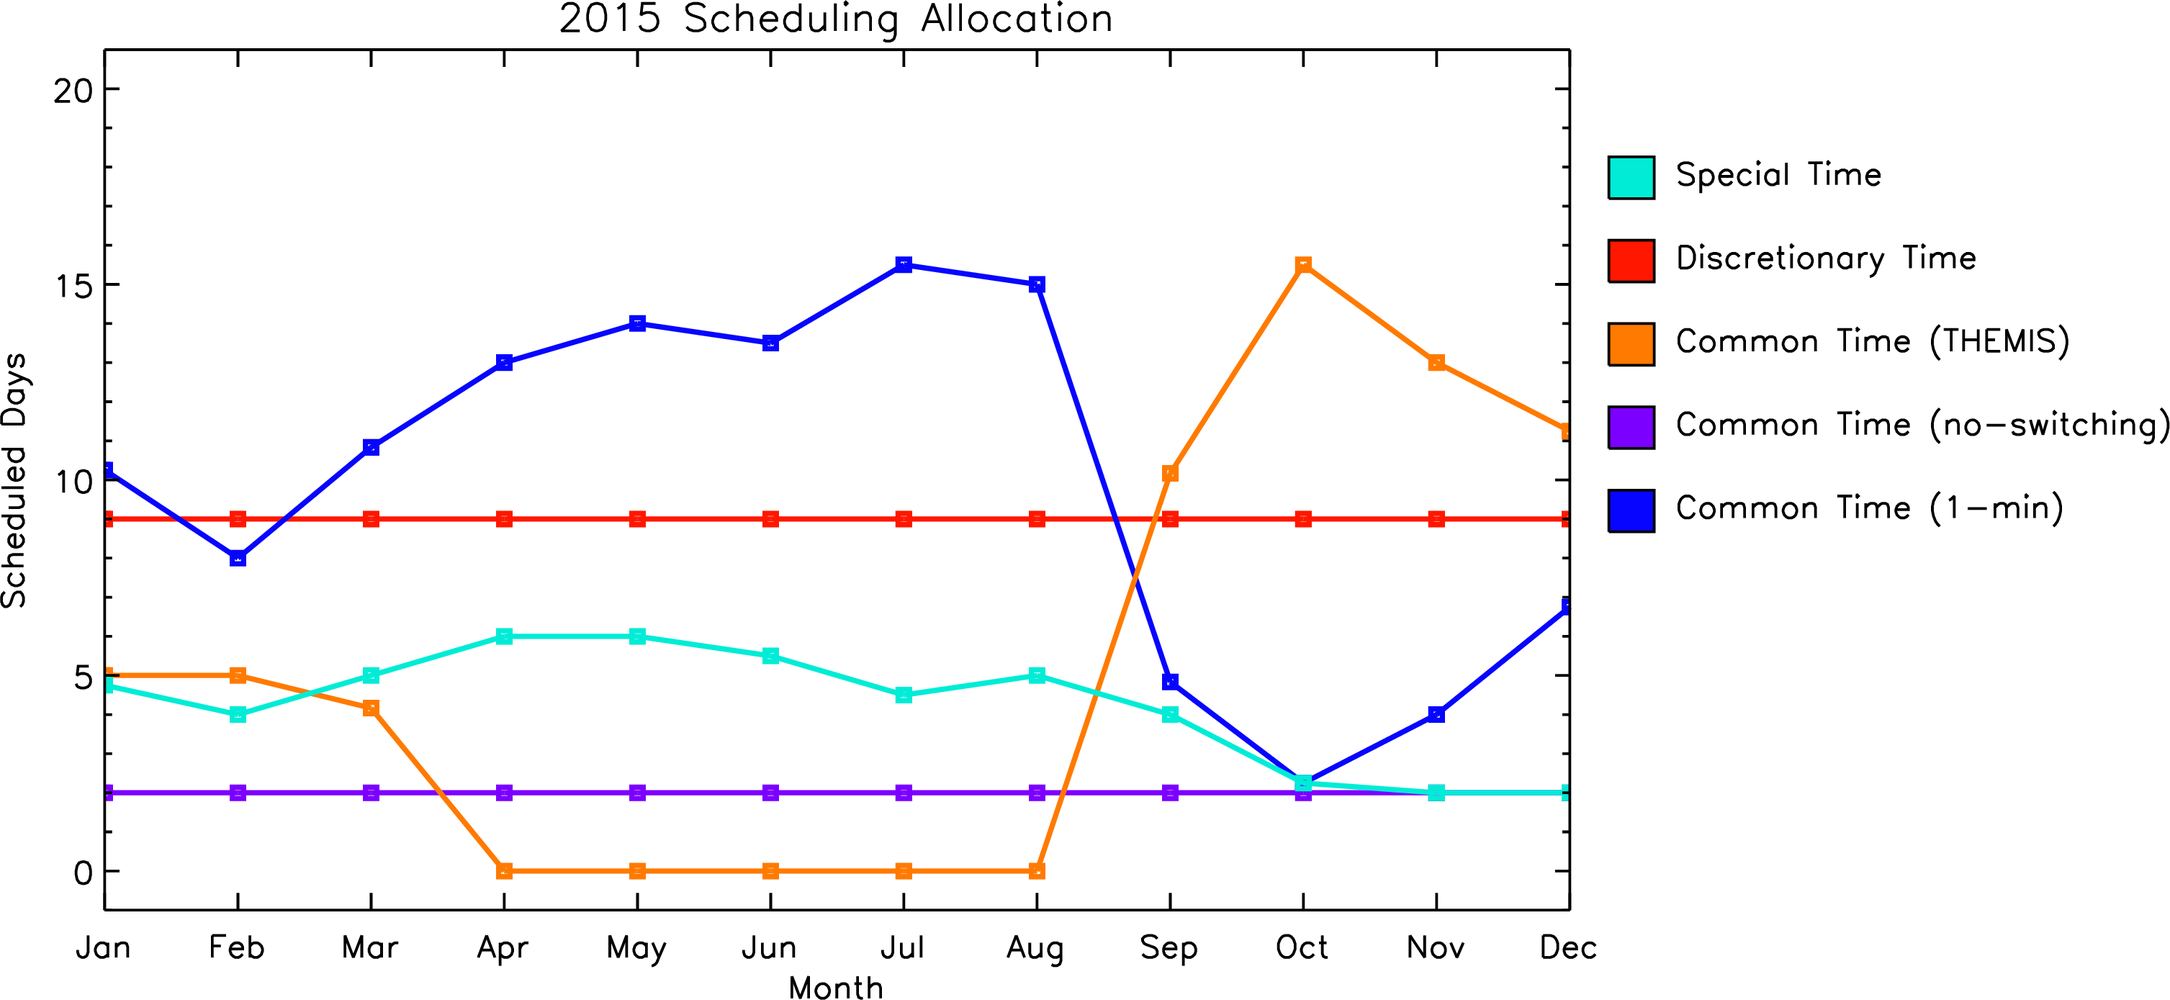
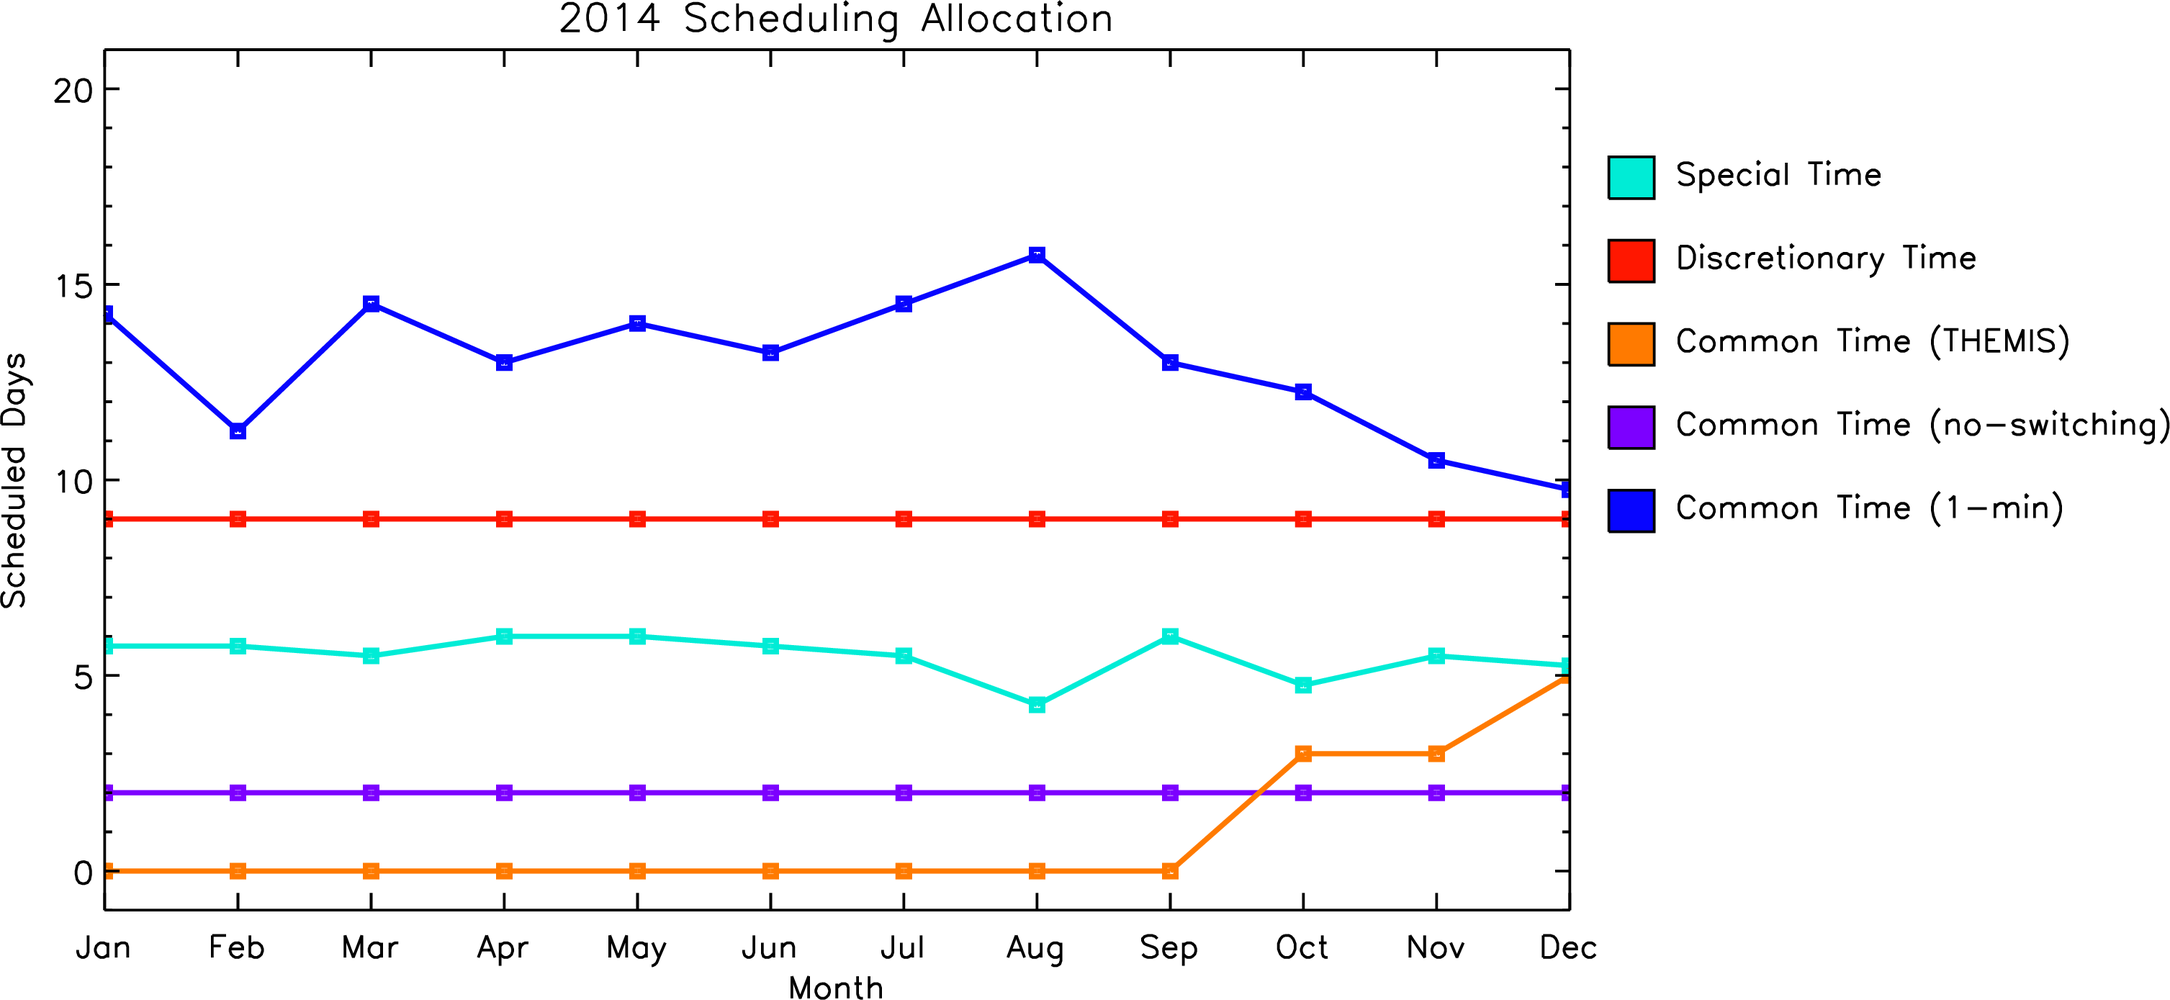
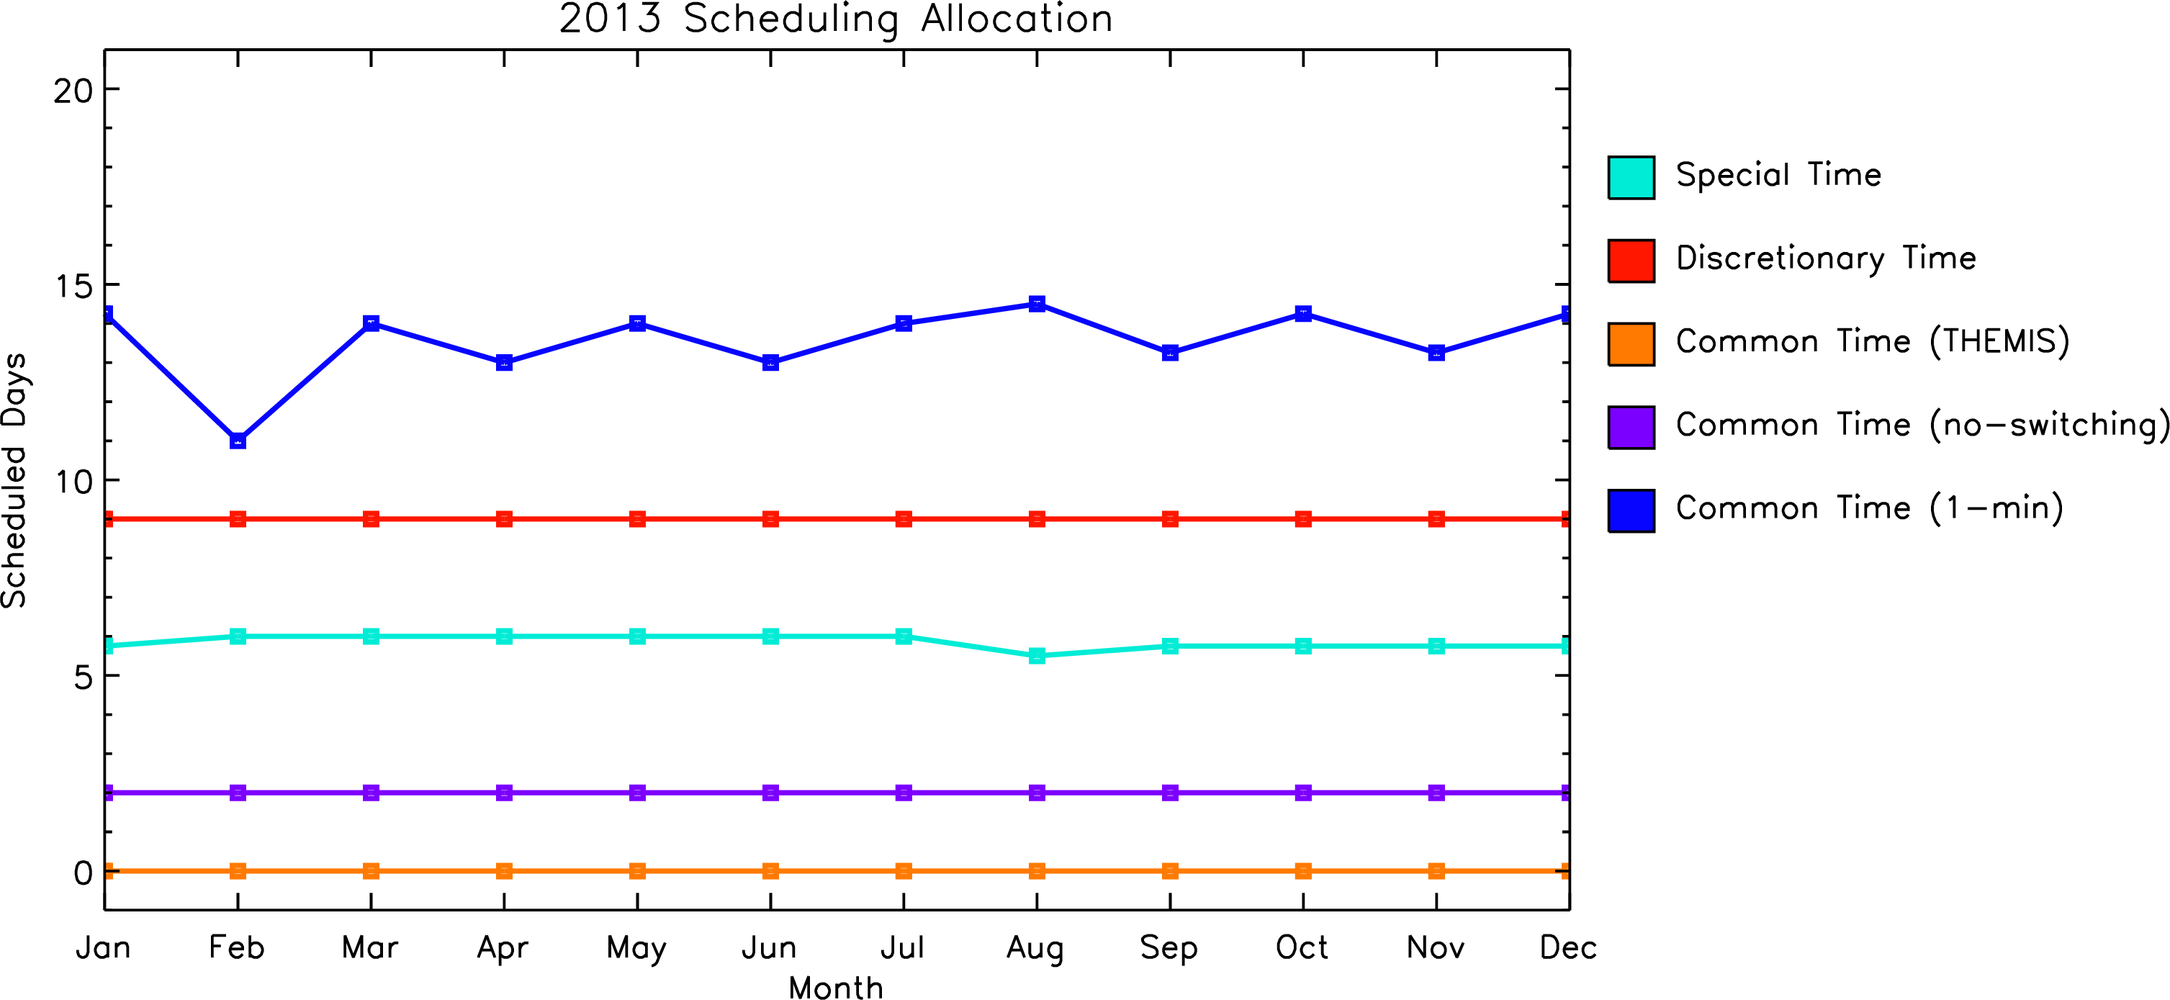
The figures on this page are an attempt to track the allocation between Common Time, Special Time, and Discretionary Time across each year from 2008-present. These yearly distributions have been parsed directly from the schedule files distributed by the Scheduling Working Group and do not reflect the true balance of operational time on a particular radar.
Jump to: Summary | 2026 | 2025 | 2024 | 2023 | 2022 | 2021 | 2020 | 2019 | 2018 | 2017 | 2016 | 2015 | 2014 | 2013 | 2012 | 2011 | 2010 | 2009 | 2008
Summary (2008-Present)


- top -
2026

- top -
2025
- top -
2024
- top -
2023
- top -
2022
- top -
2021
- top -
2020
- top -
2019
- top -
2018
- top -
2017

- top -
2016
- top -
2015
- top -
2014
- top -
2013
- top -
2012
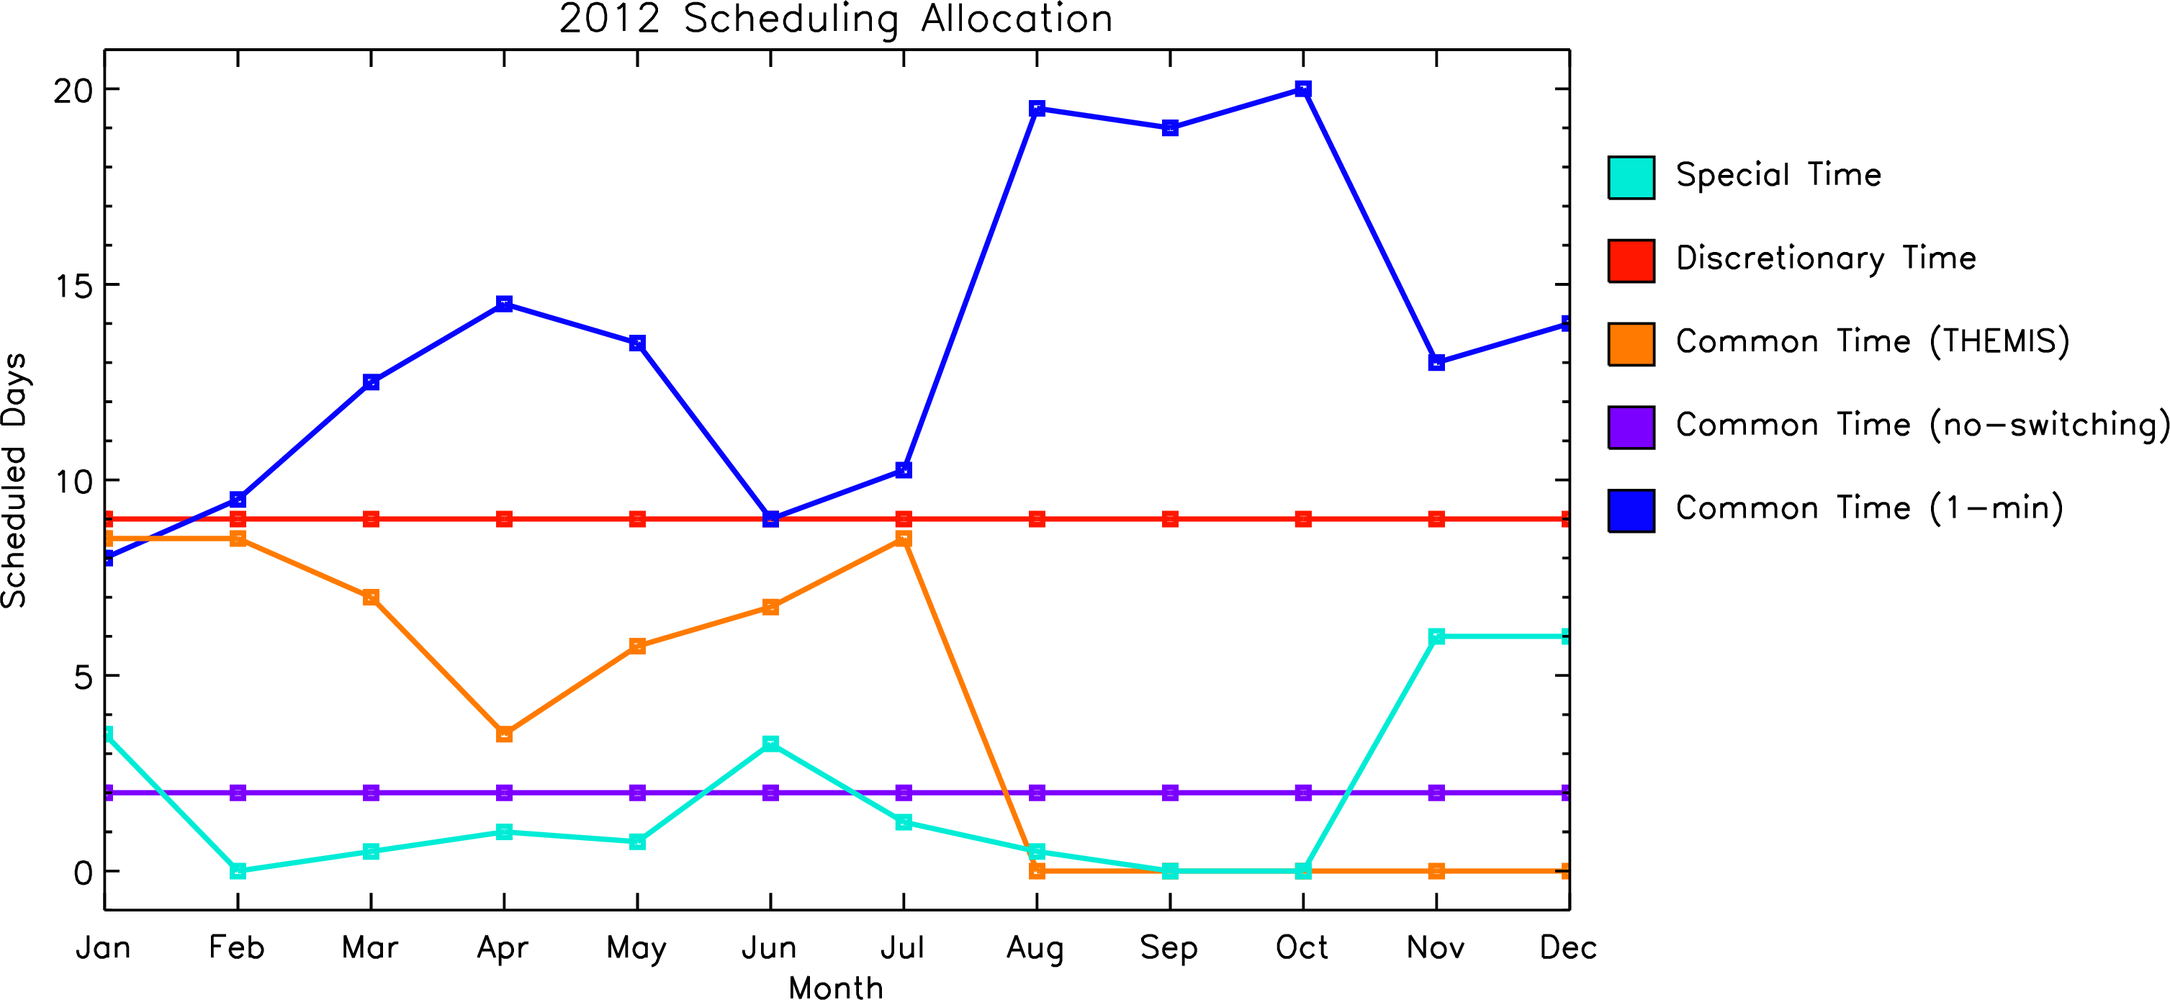
- top -
2011

- top -
2010
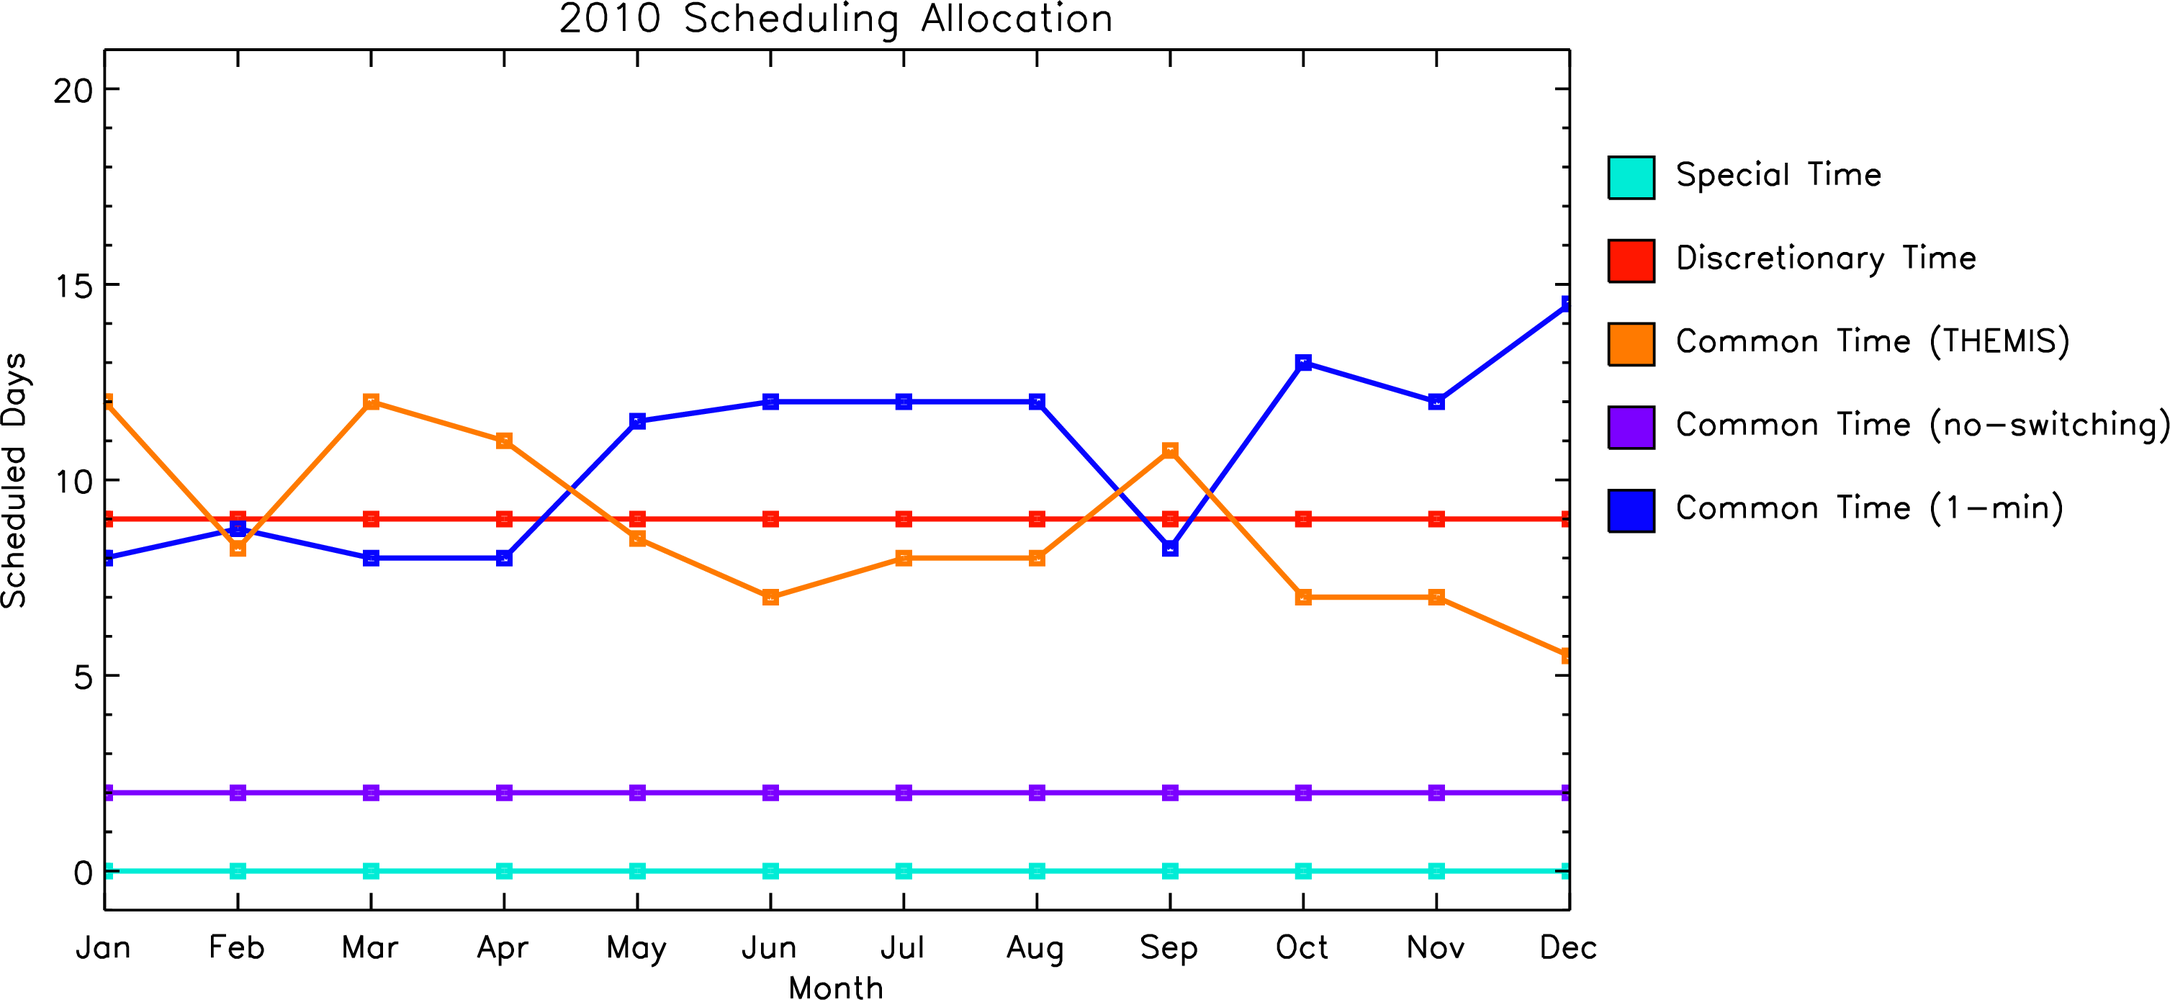
- top -
2009
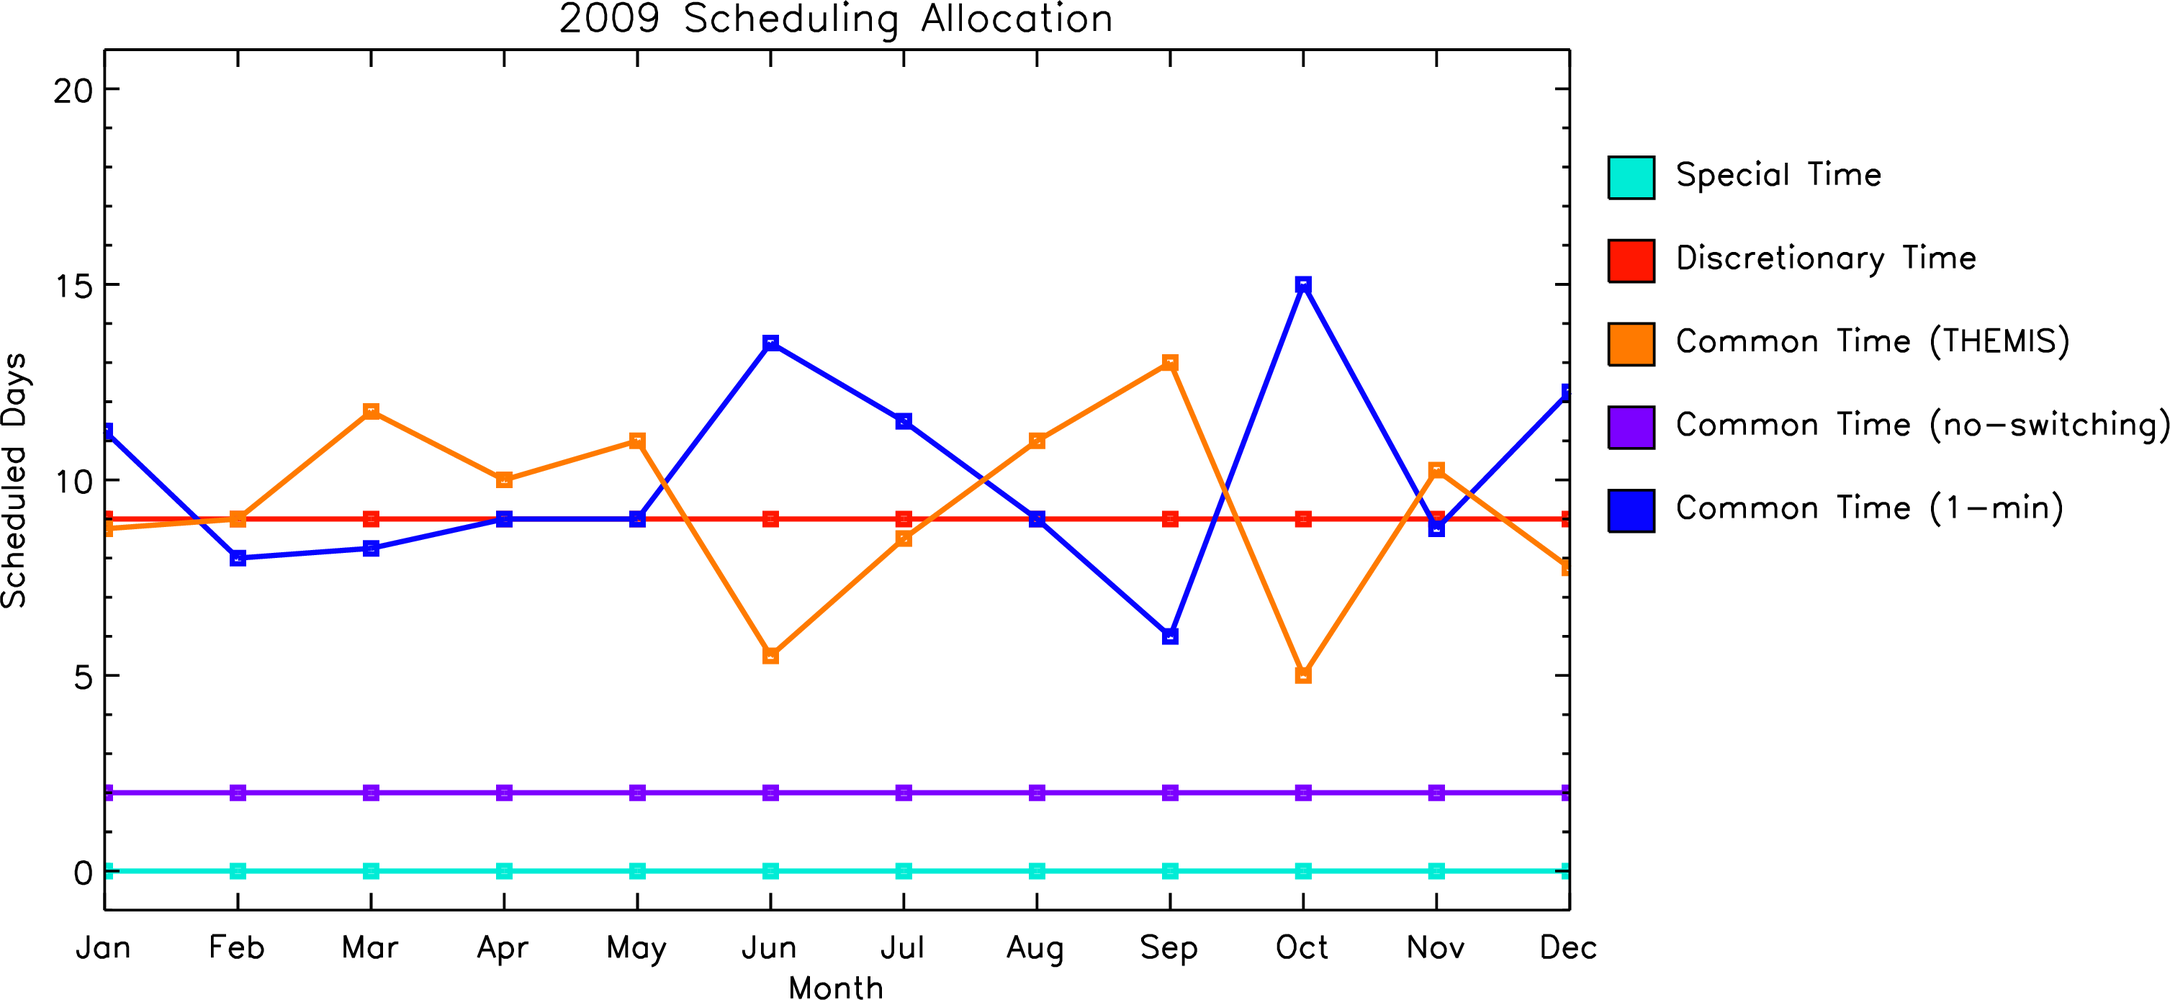
- top -
2008
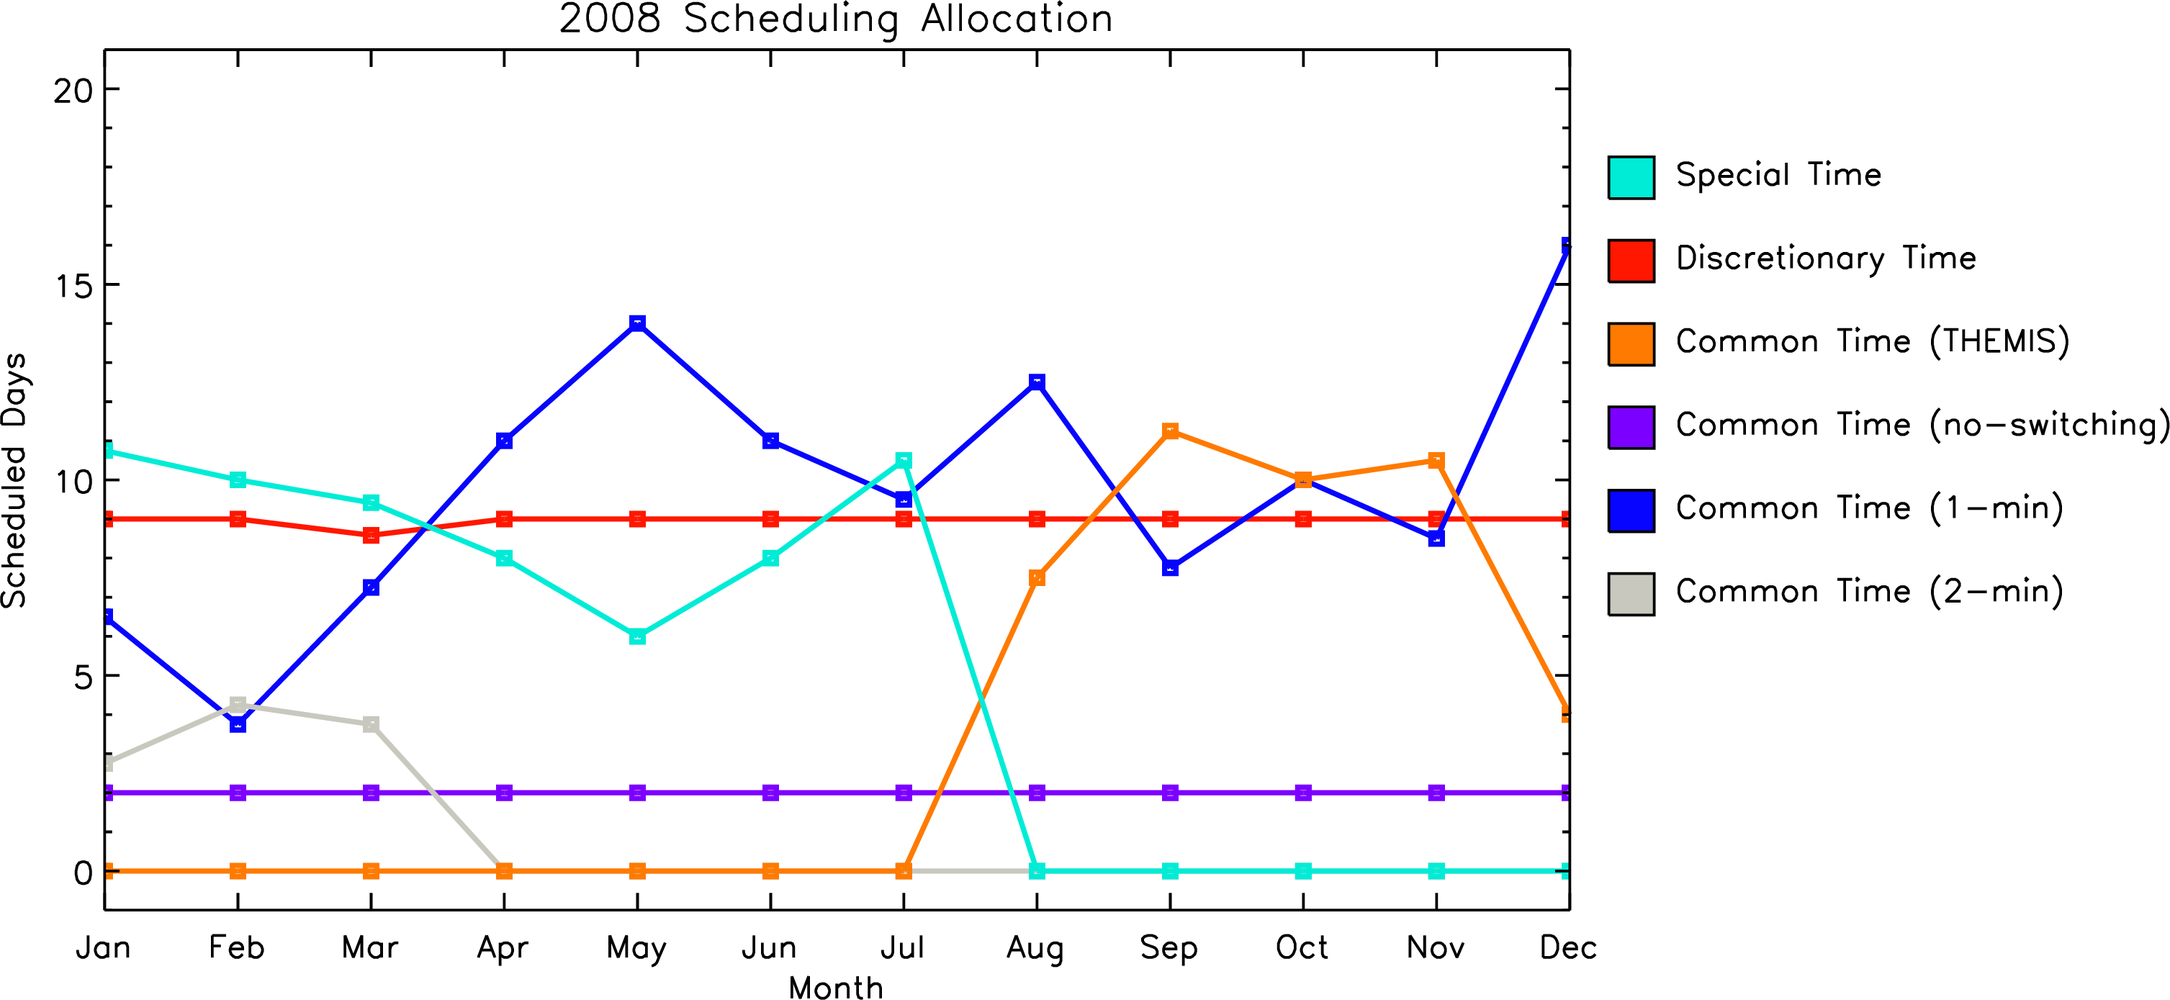
- top -
This material is based upon work supported by the National Science Foundation under Grant Number AGS-1524667. Any opinions, findings, and conclusions or recommendations expressed in this material are those of the author(s) and do not necessarily reflect the views of the National Science Foundation.